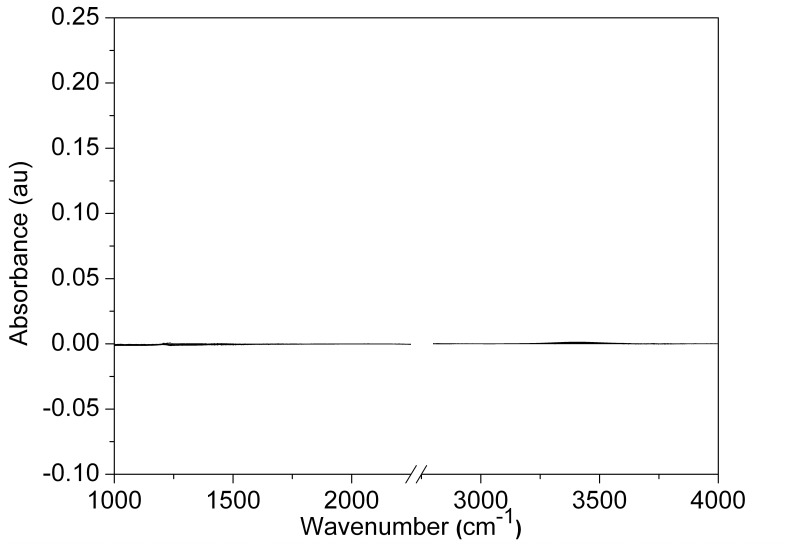
Figure 3. FTIR spectromicroscopy difference spectra of Rat-1 Fibroblasts in lag phase.
FTIR spectra from a cluster of lag phase Rat-1 cells grown on a CaF2 optical slide. Spectra were recorded (25×25 µm2 aperture) over 160 minutes after washing the cells with DMEM prepared with 100% 2H2O The initial spectrum (defined as t = 0) was used as the reference. The scale is the same as that used in Figure 2A . The horizontal line indicates that there is essentially no difference between the various spectra.

