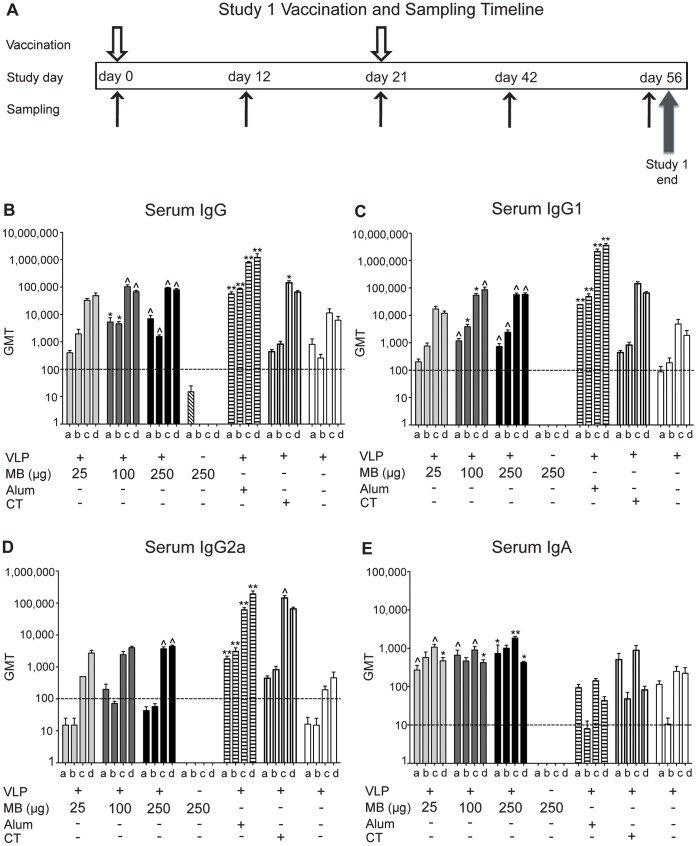
Figure 1. VLP vaccination and sampling schedule of mice and VLP-specific humoral immune response.
(A) Timeline of study 1 vaccinations and sample collection days. Serum VLP-specific IgG (B), IgG1 (C), IgG2a (D), and IgA (E) production following IN delivery of VLP and MB (25 µg, 100 µg, or 250 µg), MB alone (250 µg), VLP and alum delivered subcutaneously, VLP and CT delivered IN, or VLP alone delivered IN on day 0 and day 21. Serum samples were collected on days 0 (not shown), 12 (a), 21 (b), 42 (c), and 56 (d) and analyzed for VLP-specific antibody production by ELISA and presented as the geometric mean titer (GMT). Error bars represent the standard error of the means. Values that were significantly different from the values for the PBS control group are shown as: ΛP<0.05, *P<0.01, **P<0.001. Samples from the PBS group of mock-vaccinated mice were negative by ELISA (not shown). The horizontal hatched line indicates the limit of detection for the assay.

