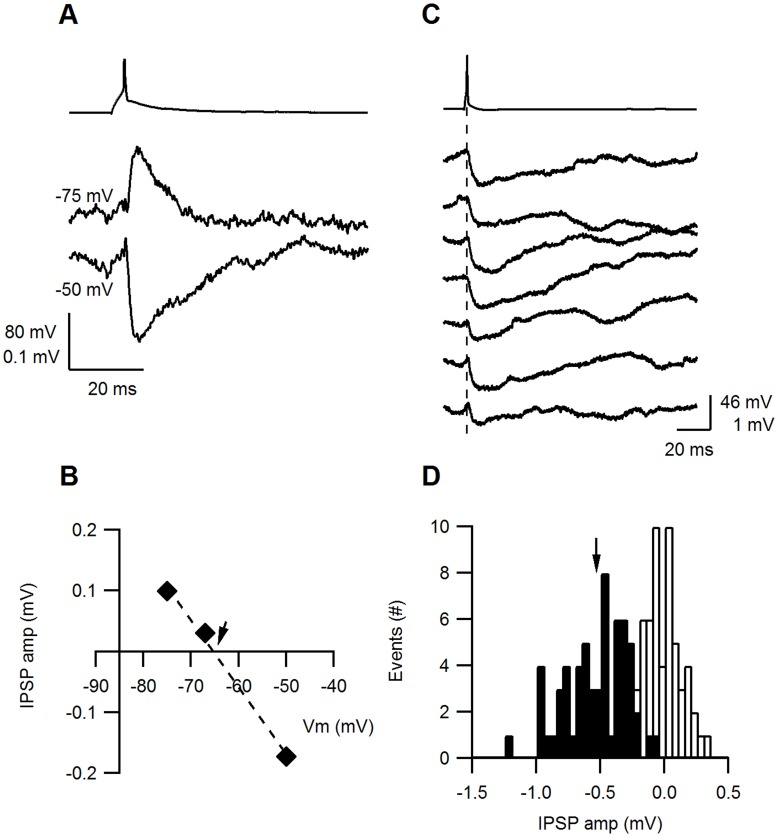
Figure 3. Inhibitory synapses.
A. An AP evoked in the presynaptic inhibitory neuron and the simultaneously recorded IPSP (average of 15 traces, each) from the postsynaptic excitatory neuron at two membrane potentials. The IPSP was hyperpolarizing at a Vm of −50 mV but depolarizing at −75 mV. B. The IPSP amplitude plotted as function of the membrane potential (Vm). The data were fitted with a straight line (dashed) intercepting the x-axis (indicated by an arrow) at −65 mV. C. In 7 subsequent traces, IPSP amplitudes varied in response to single presynaptic APs, but no failures were observed. The postsynaptic Vm was held at −50 mV D. A histogram of the IPSP amplitudes (filled bars) was constructed from 60 traces and the background noise (empty bars). The IPSP histogram was fitted with a Gaussian distribution with a median at −0.53 mV (arrow) and a σ of 0.36 mV.

