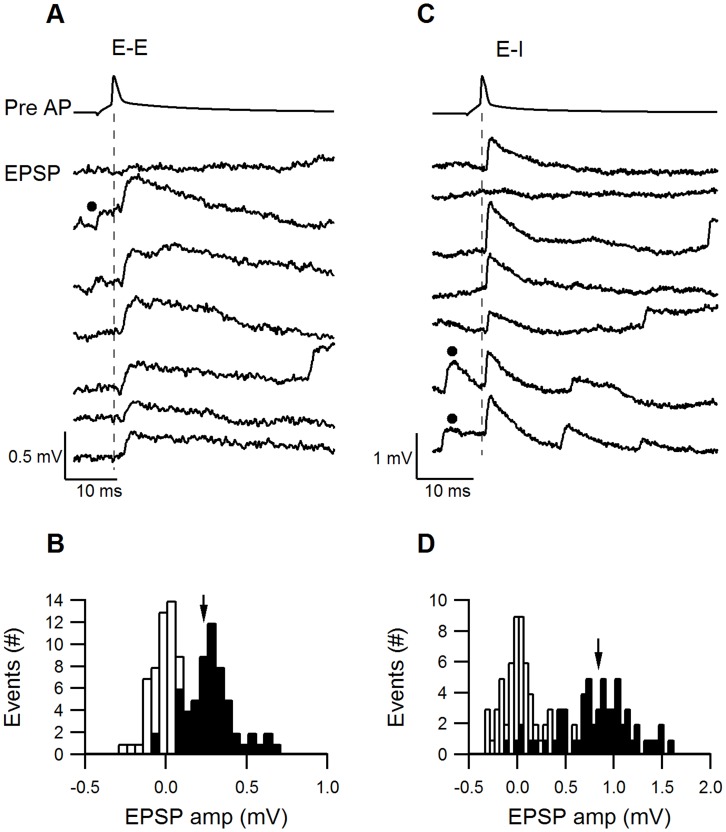
Figure 4. Reliability of E–E and E–I synapses.
A. Fluctuations in the EPSP amplitudes at an E–E connection. The upper trace illustrates a presynaptic AP and the 7 subsequent traces show the response evoked in the excitatory postsynaptic cell. B. The EPSP amplitude histogram (filled bars) has a median at 0.24 mV and a σ of 0.152 mV. Black dots in A and B indicate spontaneously occurring EPSPs prior to stimulation. C. Fluctuations in the EPSP amplitudes at an example E–I connection. The upper trace illustrates a presynaptic AP and the 7 subsequent traces show the response evoked in the inhibitory postsynaptic cell. D. A broad distribution of the E–I EPSPs, with a median at 0.84 mV and a σ of 0.435 mV.

