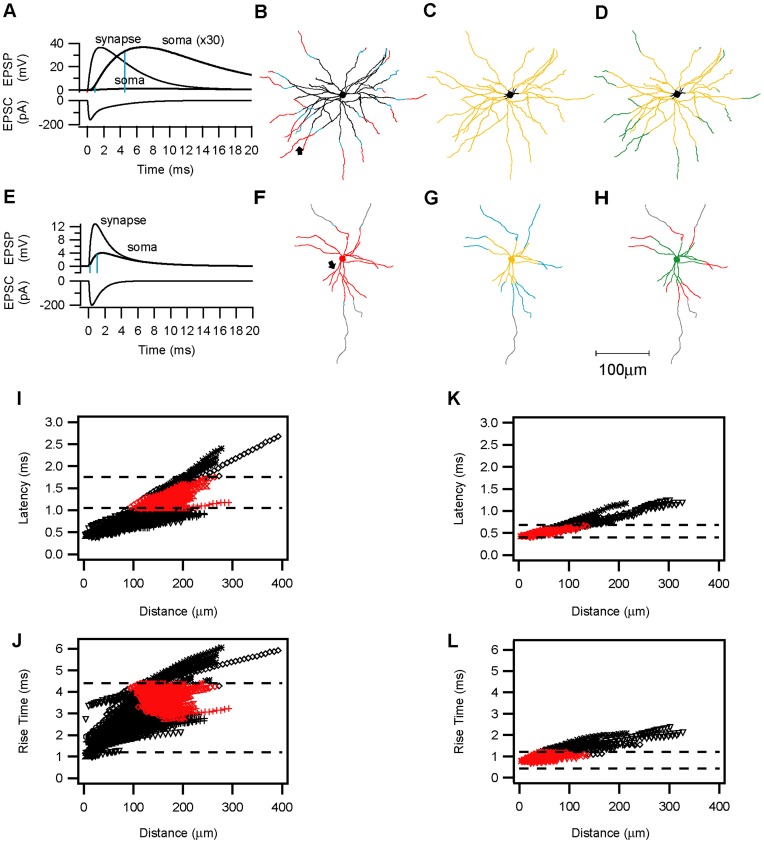
Figure 7. Compartmental model simulations of synaptic kinetics.
Electrotonic attenuation of the synaptic current along the dendrites en route to the soma, results in smaller and slower somatic EPSPs. A, E. A single synaptic contact with a conductance of 3.8 nS was simulated on (A) a spiny stellate or (E) a basket cell dendrite at the location where a putative contact was identified (arrows in B and F, respectively). The decay time constant (τ2) of the conductance in E was faster than in A (1 ms vs. 2.3 ms). The simulated EPSCs and the resulting EPSPs at the synapse are drawn in a thin line. The same EPSPs measured in the soma are drawn with a thick line. In (A) the somatic potential trace was multiplied (×30) to allow direct comparison of the kinetics. The 10% and 90% EPSP amplitudes are marked by the blue lines. Note that the more distal contact simulated in A is more strongly delayed, slowed and attenuated than the proximal contact simulated in E. B–H. A single synaptic activation was simulated successively in all compartments of the spiny stellate (B–E) and smooth basket (F–H) neurons. In each compartment, the latency of the EPSP arrival at the soma and the somatic 10%–90% EPSP rise times were analyzed and compared with the experimentally observed values. The somatic and dendritic compartments were then colored according to the following categories: Black: simulated values lower than the smallest experimentally observed latency or rise time. Grey: simulated values larger than the largest experimentally observed latency or rise time. Blue: simulated values within the range between the smallest and the largest observed values. Red: Mean EPSP latency (average±s.d.). Yellow: Mean EPSP rise time (average±s.d.). Green: Overlapping compartments in which both rise-times and latencies were within the average range. B, F. Latency plots. C, G, Rise time plots. D, H, overlap plots of latencies and rise times. The scale bar is 100 µm. I–L. Simulations were repeated in 5 spiny stellate cells and 1 star pyramid (I, J) and 4 basket cells(K, L) neurons, each presented by a different symbol. I, K, Somatic EPSP latencies plotted against the dendritic distance from the soma for all spiny neurons (I) and basket cell (K) dendrites. J, L, Plots of the rise times at different dendritic distances from the soma. The dashed lines represent the experimental values of the corresponding average+s.d. Red symbols represent the overlap compartments for the latency and rise times in each neuron. Spines in A–D, I–J, were incorporated by scaling Cm and Rm in the dendrites. A faster conductance (as in E) was simulated in F–H, K–L.

