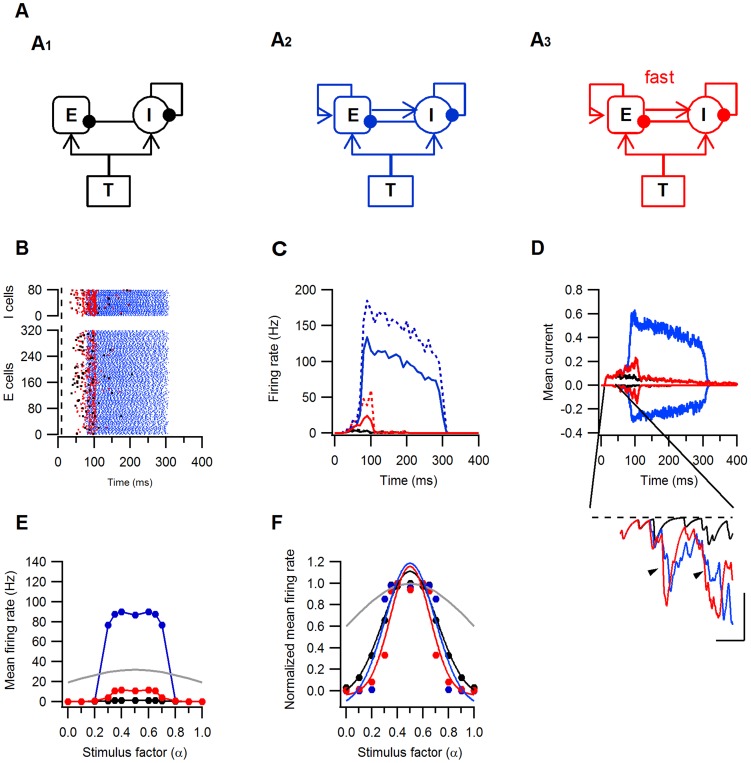
Figure 9. Effects of fast E–I recruitment on the activity and tuning curves of a model recurrent L4 network.
Three models were used to simulate activity in the recurrent network. All models included excitatory (E) and inhibitory (I) L4 neurons and feedforward thalamic (T) input synapses and were identical in all but the recurrent excitatory synapses. Excitatory and inhibitory synapses were drawn with arrows and filled circles, respectively. A1. The feedforward model in which E–E and E–I synapses were silenced. A2. The second model incorporating recurrent E–E and E–I synapses with identical kinetics and latencies. A3. The third model is structurally identical to A2 but E–I synapses have faster kinetics and shorter latencies. Models 1, 2 and 3 and all the results are colored black, blue and red, respectively. A–D, Responses of all three models to the same feedforward synaptic input (Fin = 29.5 Hz). B. Raster plots of the excitatory (E) and inhibitory (I) spike times, dashed line marks stimulus start. C. Peri-stimulus histogram of the firing rates of the excitatory (solid lines) and inhibitory (dashed lines) neurons binned at 10 ms intervals. D. Mean excitatory (positive to 0) and inhibitory (negative to 0) currents to the excitatory L4 neurons. Current is given in arbitrary units. The inset shows the mean inhibitory current between t = 40 and 80 ms from simulation start. The arrowheads point towards the earlier onset and faster rise of the current in model 3 compared to model 2. Scale bars are 10 ms and 0.03 I. E–F. Tuning curves of the excitatory neurons. E. Mean firing rates as a function of the stimulus parameter α, note the many-folds amplification of the responses in models 2 (blue) and 3 (red) in respect to model 1(black). F. The mean firing rates normalized to the maximal response as a function of α. The lines represent the best Gaussian fits to the normalized responses. The grey line is the normalized input frequency. Note the narrowing of the tuning curve in model 3.

