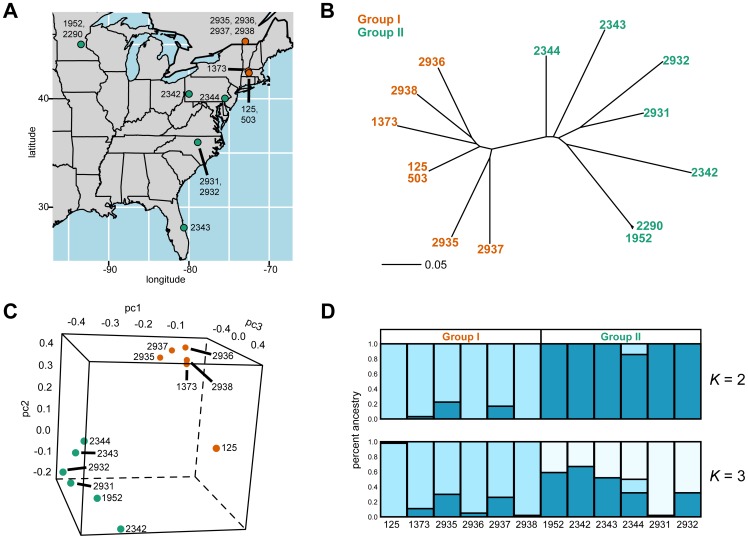
Figure 1. Sampling locations, genealogy, and population structure of C. reinhardtii isolates.
A map depicting where each of the sequenced strains was isolated is shown in A [8], [10], [11], [12], [46]. Each of the unique sampling locations is plotted on the map. We color the isolates according to the groups described in the main text. Group I isolates are in orange, and Group II isolates are in green. The isolates that were obtained from a location are written next to the circle for that location. 137c, the progenitor to CC-125 and CC-503, was obtained in 1945. CC-1373 was also isolated in 1945. The rest of the strains were collected in the 1980s and 1990s. A neighbor-joining tree of the strains is shown in B, with the genetic distances determined as the fraction of examined SNPs that were different between two strains. The loadings of the strains on the first three principal components is shown in C. D displays STRUCTURE results from K = 2 and K = 3. The barcharts indicate how much of the isolates' genomes are derived from each of the K ancestral subpopulations in the model.

