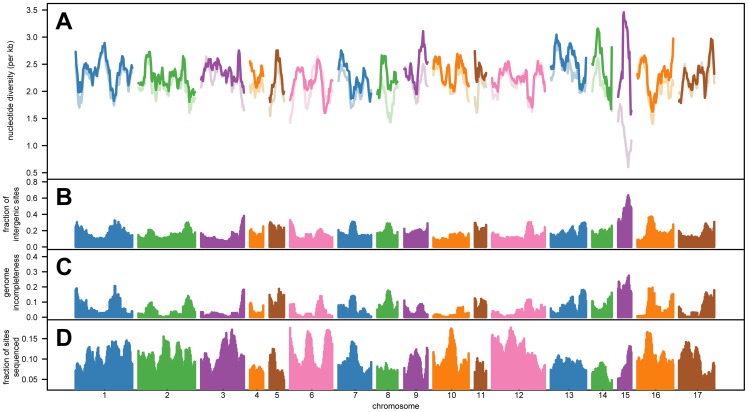
Figure 3. Analyses of levels of nucleotide diversity across the genome.
In A, we plotted the observed levels of sequence diversity in 100 kb windows throughout the genome, with color-coding by chromosome. The 10-window local averages for θW are shown in colored lines for each of the chromosomes. The lighter lines show results with intergenic DNA included, while the darker lines show results with intergenic DNA excluded. In B, the fraction of intergenic DNA sites in a genomic window is plotted. In C, the fraction of sites in the reference genome sequence that are coded as ambiguous bases within a window is shown. In D, the fraction of sites within a window at which every strain was sequenced is depicted. Vertical bars that are color-coded by chromosome are used to show the measurements in B, C, and D.

