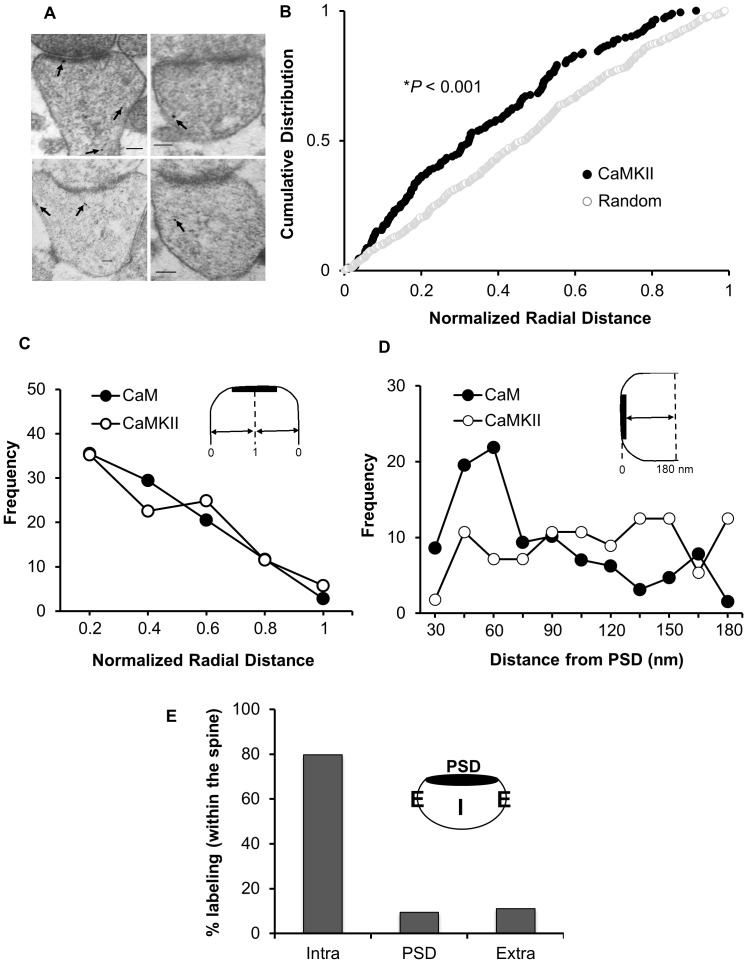
Figure 3. CaMKII lateral distribution correlates with that of CaM within the spine.
(A) Representative images of immunogold-EM for endogenous CaMKII in dendritic spines of CA1 hippocampal neurons. Arrows indicate anti-CaMKII immunogold particles. Scale bar, 100 nm. (B) Cumulative probabilities of normalized radial distance. The distance of each gold particle from the plasma membrane (within the spine) was normalized (x axis) to the corresponding radius of the spine measured through that particle. CaMKII distribution within the spine is significantly different from a theoretical random distribution (n = 173, p<0.001). (C) Comparison of CaMKII and CaM distribution using cumulative probabilities of normalized radial distance. CaMKII and CaM show similar patterns of lateral distribution. The highest fraction of labeling for both occurs within 0.2 of the radial distance. (D) Vertical distribution of CaMKII and CaM with respect to PSD. The absolute distance between each gold particle to the PSD was measured. (E) Distribution of CaMKII between the different sub-compartments within the spine.

