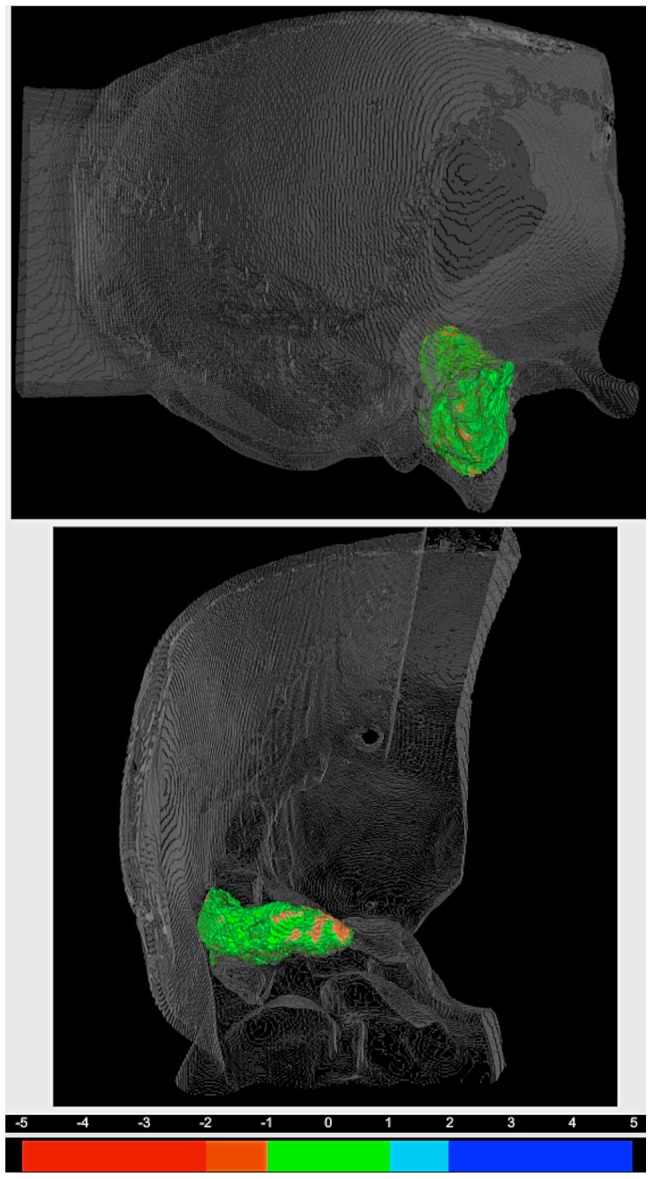
Figure 3. Illustration of Drill Cavity Overlap Error.

The error-to-color coded surface to surface distance map of drill cavity index number 6 is displayed in a 3D rendering of the corresponding temporal bone. The top view is from lateral and the bottom view shows the cavity from anterior. The legend for the error-to-color representation is provided under the 3D renderings. Note the green areas within the distance map denote errors of under 1 mm, and the orange areas represent virtual underestimation errors of between 1 and 2 mm.
