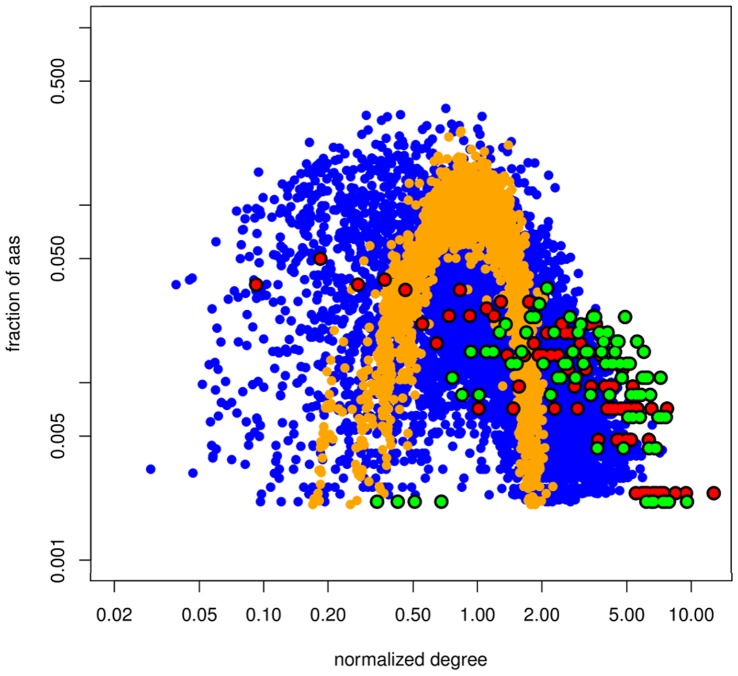
Figure 1. Degree distribution of the MIN and DN.
Fraction of amino acids versus the normalized degree in the MINs (blue dots) and DNs (orange dots). Degrees were normalized with respect to the average degree. All DNs followed a Poisson distribution (α = 0.01, KS test). 43.8% of MINs followed a power-law distribution and 29.9% followed a Poisson distribution (α = 0.01). Red dots: normalized degree distribution in the MIN for Pfam family PF01432, showing a truncated power-law distribution. Green dots: normalized degree distribution in the MIN for Pfam family PF00118. Logarithmic scale.

