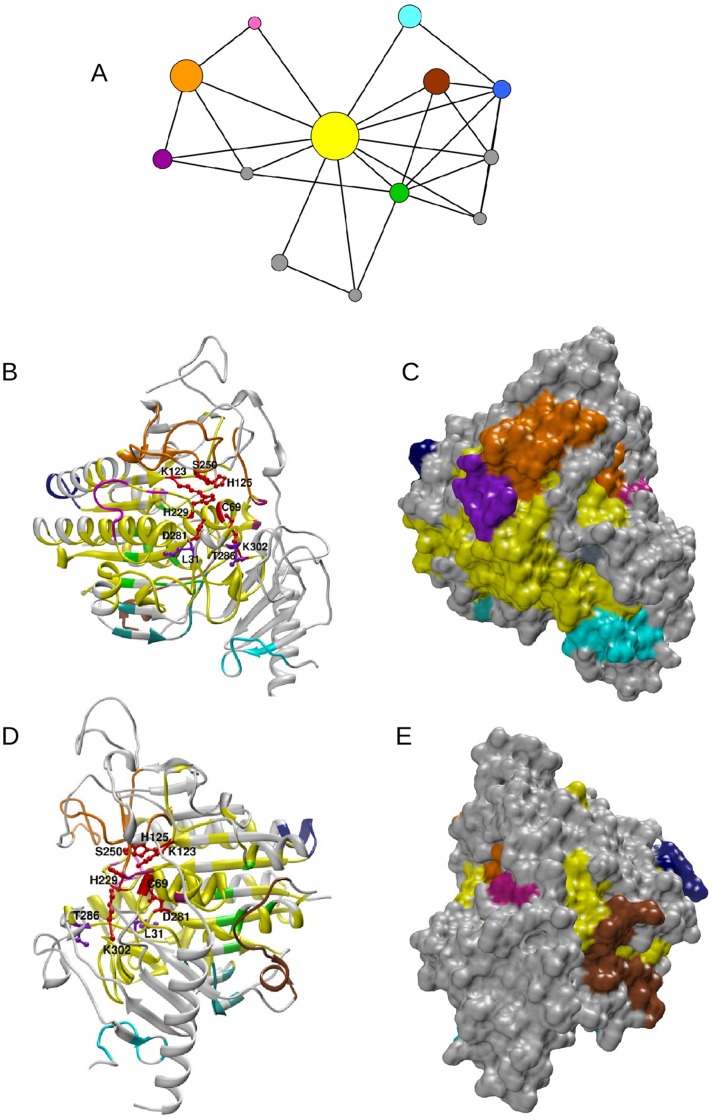
Figure 4. Network of MI3D clusters and mapping onto the protein structure.
(A) 3DCN of the arilsulfatase A (pdb code: 1AUK chain A, PF00884). Catalytic MI3D clusters: yellow, orange and green. Non-catalytic MI3D clusters: magenta, brown, blue, cyan and pink. The size of a node in the 3DCN is proportional to the number of residues in the MI3D cluster. Clusters with less than 10 residues were coloured grey. (B) Ribbon representation of the MI3D clusters of a representative structure of PF00884. Colours are as in panel A. Catalytic residues are highlighted as red balls and sticks in the ribbon plot. Disease-related mutations are represented as violet balls and sticks. (C) Surface representation of the view in panel B. (D) Same as panel B rotated 180 degrees. (E) Surface representation of the view in panel D.

