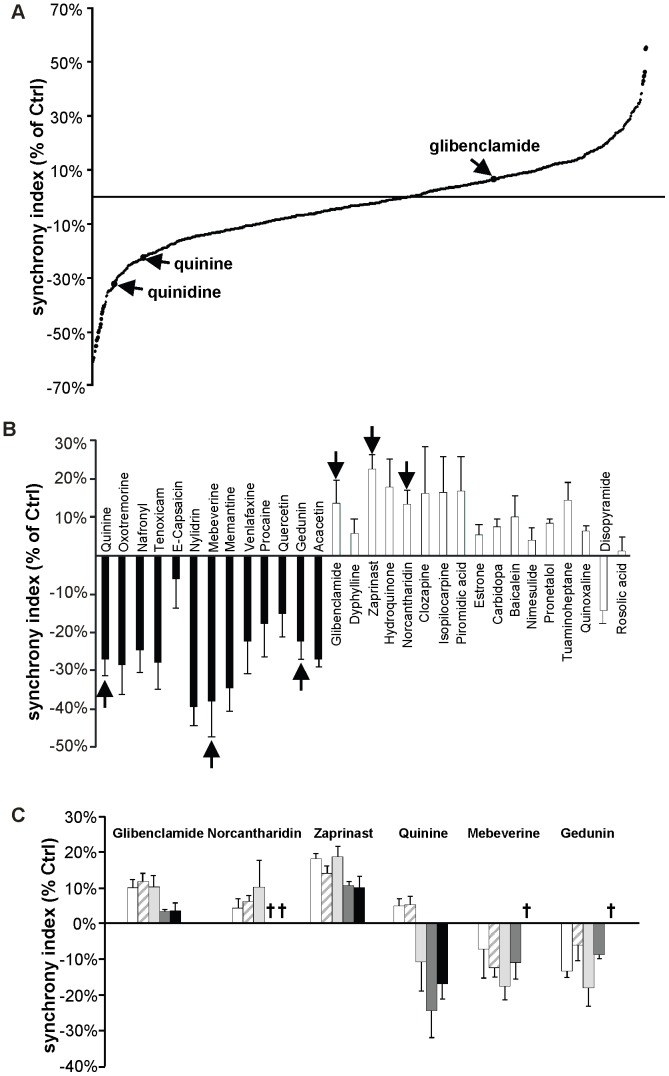
Figure 3. Primary and secondary screenings identify several molecules affecting the synchrony index of MIN6 cells.
(A) The primary screening of 1040 compounds revealed that several molecules increased or decreased the synchrony index. Each point of the curve shows the percentage change in synchrony index induced by one drug, relative to the value evaluated in WT MIN6 cells exposed to DMSO, which was the vehicle of all compounds, and served as internal control. Of note, glibenclamide increased the synchrony index by ∼12%, whereas quinine, and its stereoisomer quinidine, decreased it by 22 and 34%, respectively; (B) 17 drugs increasing (white bars) and 13 drugs decreasing the synchrony index (black bars) were repeatedly tested, and their effect on the synchrony index plotted relative to that of WT MIN6 cells exposed to DMSO. 97% of the drugs reproduced the effects observed in the primary screening. The six drugs pointed by the arrows were selected for further experiments. Data are means ± SE of four independent experiments; (C) Dose-response experiments were conducted with the six selected drugs. The effect of these drugs on the synchrony index was plotted relative to that of WT MIN6 cells exposed to DMSO. The effects on the synchrony index varied with the concentration tested. Glibenclamide, norcantharidin and zaprinast increased the synchrony index for concentrations ≤10 µM, whereas quinine, mebeverine and gedunin decreased it. Several drugs showed cytotoxicity at concentrations >10 µM. All drugs were tested at the following concentrations: 0.1 µM, 1 µM, 10 µM, 50 µM and 100 µM. “†” indicates concentrations toxic for MIN6 cells, as evaluated by cell detachment from the support. Data are means ± SE of at least four independent experiments.

