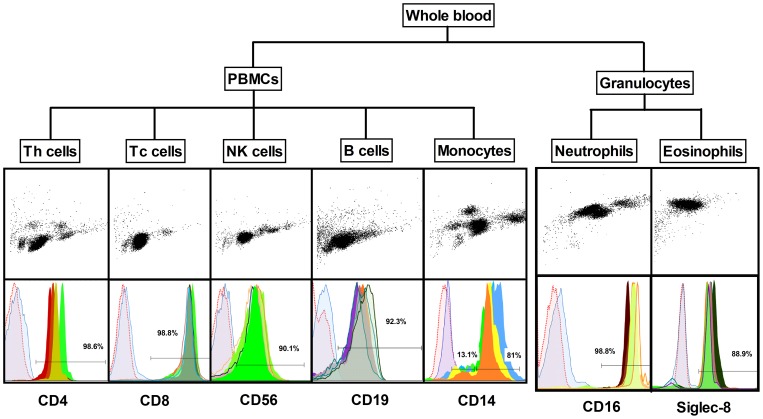
Figure 1. Schematic presentation of the isolation protocol and purity of the cell populations as measured by flow cytometry.
Peripheral blood mononuclear cells (PBMC) and granulocytes were obtained by density gradient centrifugation and seven cell populations were purified by magnetic sorting. Upper panel shows forward and side scatter which confirmed cell morphology and granularity. The lower panel shows the overlay of cell surface markers for all the six donors. The purities of the cell populations were highly similar among all the six donors. Th cells = CD4+ T cells, Tc cells = CD8+ T cells, NK cells = CD56+ NK cells, B cells = CD19+ B cells, Monocytes = CD14+ monocytes. Data analyses are based on the comparison of all cell populations to whole blood.

