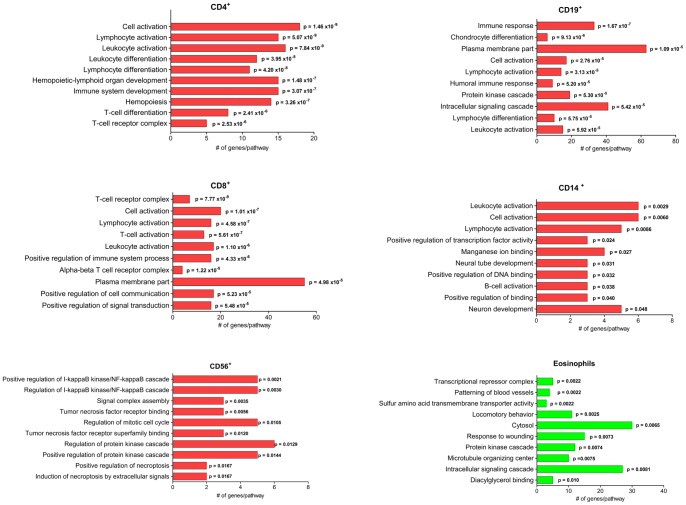
Figure 4. Gene ontology enrichment for isolated cell populations.
Gene ontology was performed using DAVID (http://david.abcc.ncifcrf.gov) [47]. The human genome was used as background and the level of significance was set to p<0.05. The top ten enriched pathways are described for genes showing significantly differentially methylated probes in comparison to whole blood where the cell population shows unmethylated state and whole blood shows methylated state according to the gamma fit model. Red color indicates peripheral blood mononuclear cells (PBMC) and green color indicates granulocytes.

