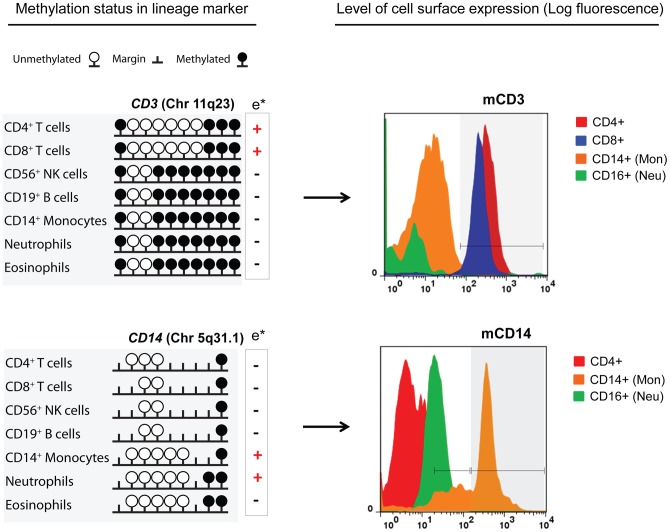
Figure 5. Differentially methylated sites are harbored by cell-specific genes but the connection between methylation status and surface expression depend on the gene and lineage.
The surface expression of CD3 and CD14 according to the methylation status of the coding gene is presented. Demethylation of CpG sites was observed in T cells expressing the CD3 marker (upper panel). For CD14 the difference between positive and negative cells involved cell-restricted marginal status in a context of demethylation (lower panel). Histograms (right) represent the log fluorescence of the marker (x-axis) and the cell counts (y-axis). Peaks within the gray shaded gates represent positive populations. For CD14 two gates are presented, the “low” which include monocytes and a fraction of neutrophils and the “high” population of monocytes. m = membrane; e* = positive or negative cell expression of the marker according to the Human Leucocyte Differentiation Antigens (HLDA) Workshop and CD nomenclature (http://www.hcdm.org/Home/tabid/36/Default.aspx).

