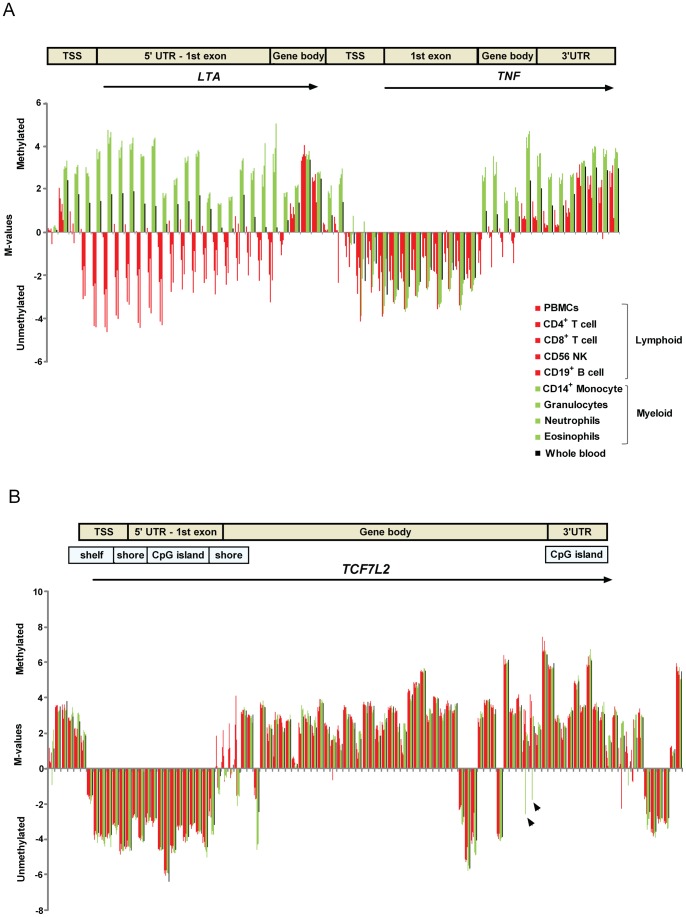
Figure 7. DNA methylation levels across the gene regions in purified cell populations for candidate genes.
DNA methylation is defined by the M-values for each cell population at a given CpG site. The M-value is calculated as the log2 ratio of the intensities of methylated probe versus unmethylated probe and describes a measurement of how much more a probe is methylated compared to unmethylated [46]. Negative numbers represent unmethylated and positive numbers represent methylated. Every cell population correspond to a vertical bar which is listed from left to right as peripheral blood mononuclear cells (PBMC), CD4+ T cells, CD8+ T cells, CD56+ NK cells, CD19+ B cells, CD14+ monocytes, granulocytes, neutrophils, eosinophils and whole blood. Lymphoid cells are colored in red bars, myeloid cells are colored in green bars and whole blood is represented by black bars. A) the asthma candidate genes lymphotoxin alpha (LTA) and tumor necrosis factor (TNF), and B) the Type 2 diabetes candidate gene transcription factor 7-like 2 (TCF7L2), black arrows indicate regions with cell type specific pattern for monocytes. TSS = transcription start site at 200–1500 bp; UTR = untranslated region, gene body including introns and exons.

