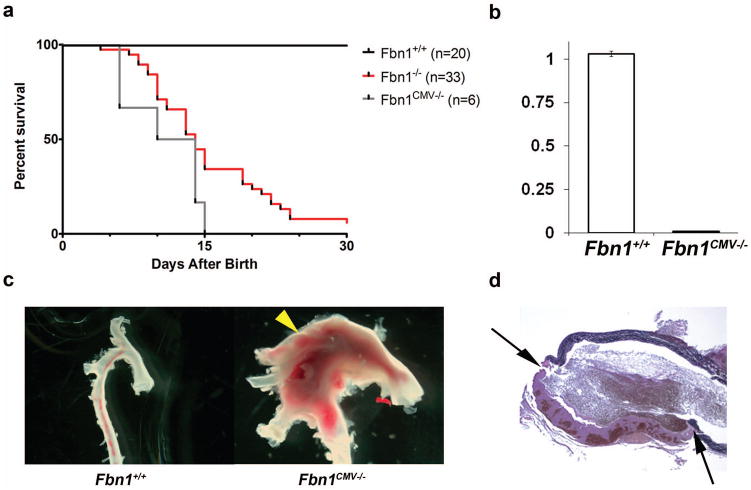
FIG. 2.
Characterization of Fbn1CMV−/− mice. (a) Survival curves showing the percent survival of various mice in days after birth with indicated the number (n) of animals for each genotype. Fbn1+/+and Fbn1CMV−/− curves are not significantly different from each other (p>0.1). (b) Bar graphs summarizing qPCR analyses of Fbn1 transcripts in neonatal lungs (white, Fbn1+/+ mice; black, Fbn1CMV−/− mice). Data are from 3 independent samples of each genotype assayed in triplicate and including ± SE. (c) Anatomy of aortas collected from P16 Fbn1+/+ and Fbn1CMV−/−mice showing a large dilation (arrowhead) in the latter sample. (c) Illustrative cross-section image of a dilated ascending aorta of Fbn1CMV−/− mice demonstrating a tear through the aortic wall with a large thrombus (between arrows); image taken at 4X.

