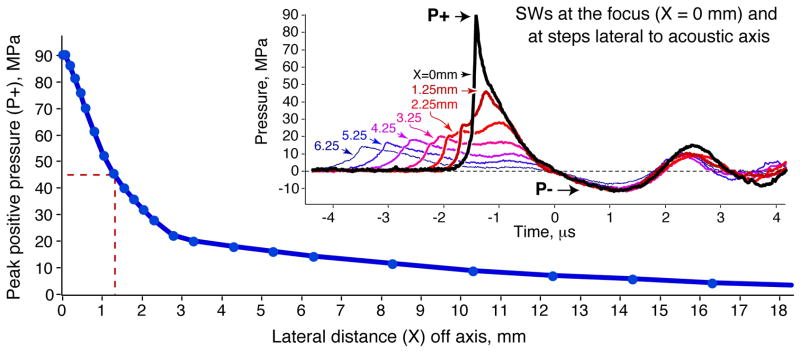
Fig. 9.
Peak positive pressure (P+) at PL-9 as a function of lateral distance off the acoustic axis. The − 6 dB width (i.e. pressure half-maximum amplitude; dashed lines) of the acoustic field was ≈ 2.6 mm (1.3 mm radius from the axis). The inset shows temporal profiles of SWs at various distances from the acoustic axis. Waveforms are aligned so that the transition from positive to negative pressure is at the zero point on the timescale. The duration of the positive-pressure phase is longer for waveforms collected off axis. Comparing waveforms at 0 and 1.25 mm, the P+ declines quickly off-axis: the P+ at 1.25 mm off-axis (≈ 45 MPa) was about half the amplitude recorded at the focus of the lithotriptor (90 MPa).

