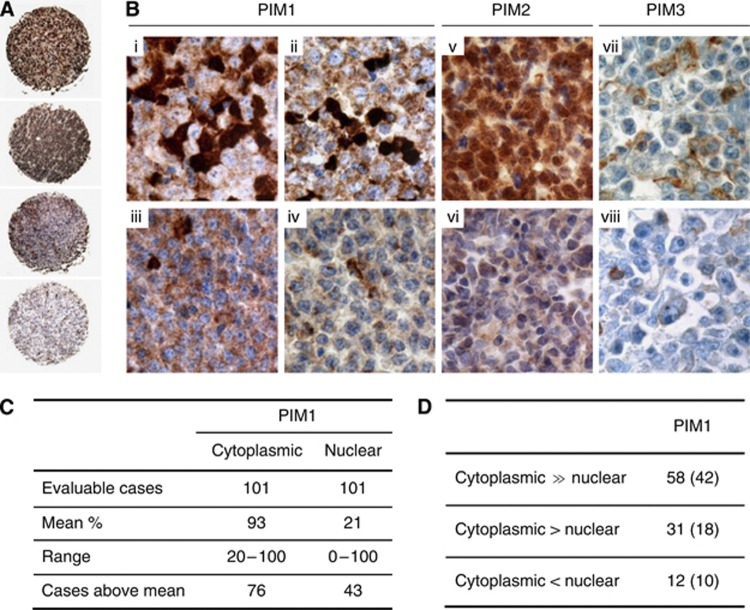
Figure 2.
The nuclear and cytoplasmic PIM1 and PIM2 expression pattern in DLBCL. (A) Tissue microarray data showing (first case) significant nuclear expression of PIM1, (second case) combined nuclear and cytoplasmic expression of PIM1, (third case case) cytoplasmic expression of PIM1 and (fourth case) a negative case ( × 4). (B) DLBCL case with (i) nuclear expression of PIM1 in 50% of the tumour cells, (ii) nuclear expression of PIM1 in 15% of the tumour cells, (iii) exclusive cytoplasmic expression of PIM1 in 100% of the tumour cells, and (iv) without expression of PIM1 (note internal positive control). DLBCL case (v) with nuclear expression of PIM2 in almost all of the tumour cells and (vi) without expression of PIM2. PIM3 in DLBCL cases (vii) with expression in 10% of the tumour cells and (viii) without expression of PIM3 (note internal positive control) ( × 400). (C) Quantitative data on PIM expression. (D) Intracellular microtopographic localisation of PIM1 in DLBCL cases; the non-GC case numbers are indicated in parentheses.

