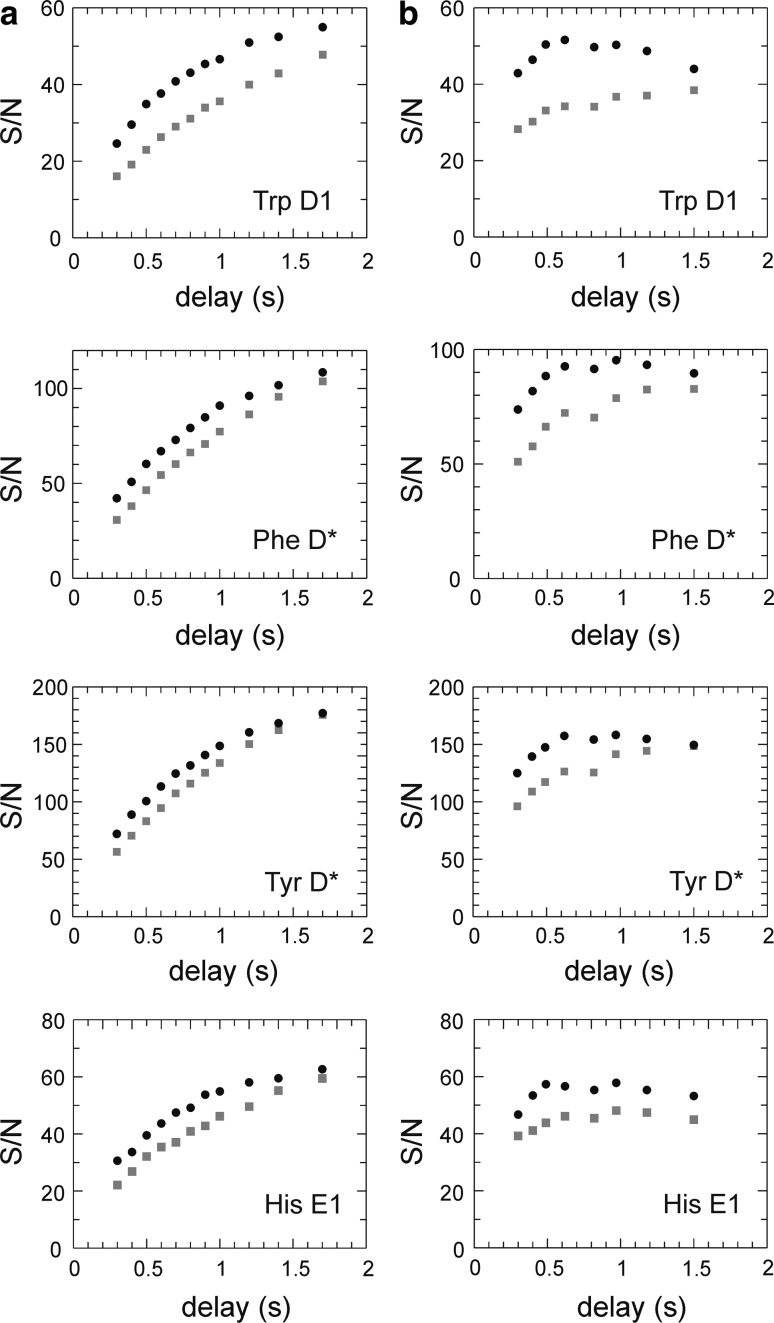
Fig. 2.
Sensitivity (signal-to-noise ratio, S/N) versus length of the recovery delay for L-optimized (black circles) and non-L-optimized (grey squares) versions of the R 1 pulse sequence. Representative data are shown for different aromatic 13C sites (Trp181 Cδ1, Phe163 Cδ*, Tyr247 Cδ*, and His208 Cε1). a data acquired with a constant number of transients. b data acquired with a constant total experiment time. An optimal recovery time was estimated to 0.6 s for L-optimized and 1.5 s for non-optimized versions (right-hand column). The average gain in S/N for L-optimization is 35 % (Trp Cδ1), 10 % (Phe Cδ*), 10 % (Tyr Cδ*), and 25 % (His Cε1). Similar results are obtained for the R 2 experiment

