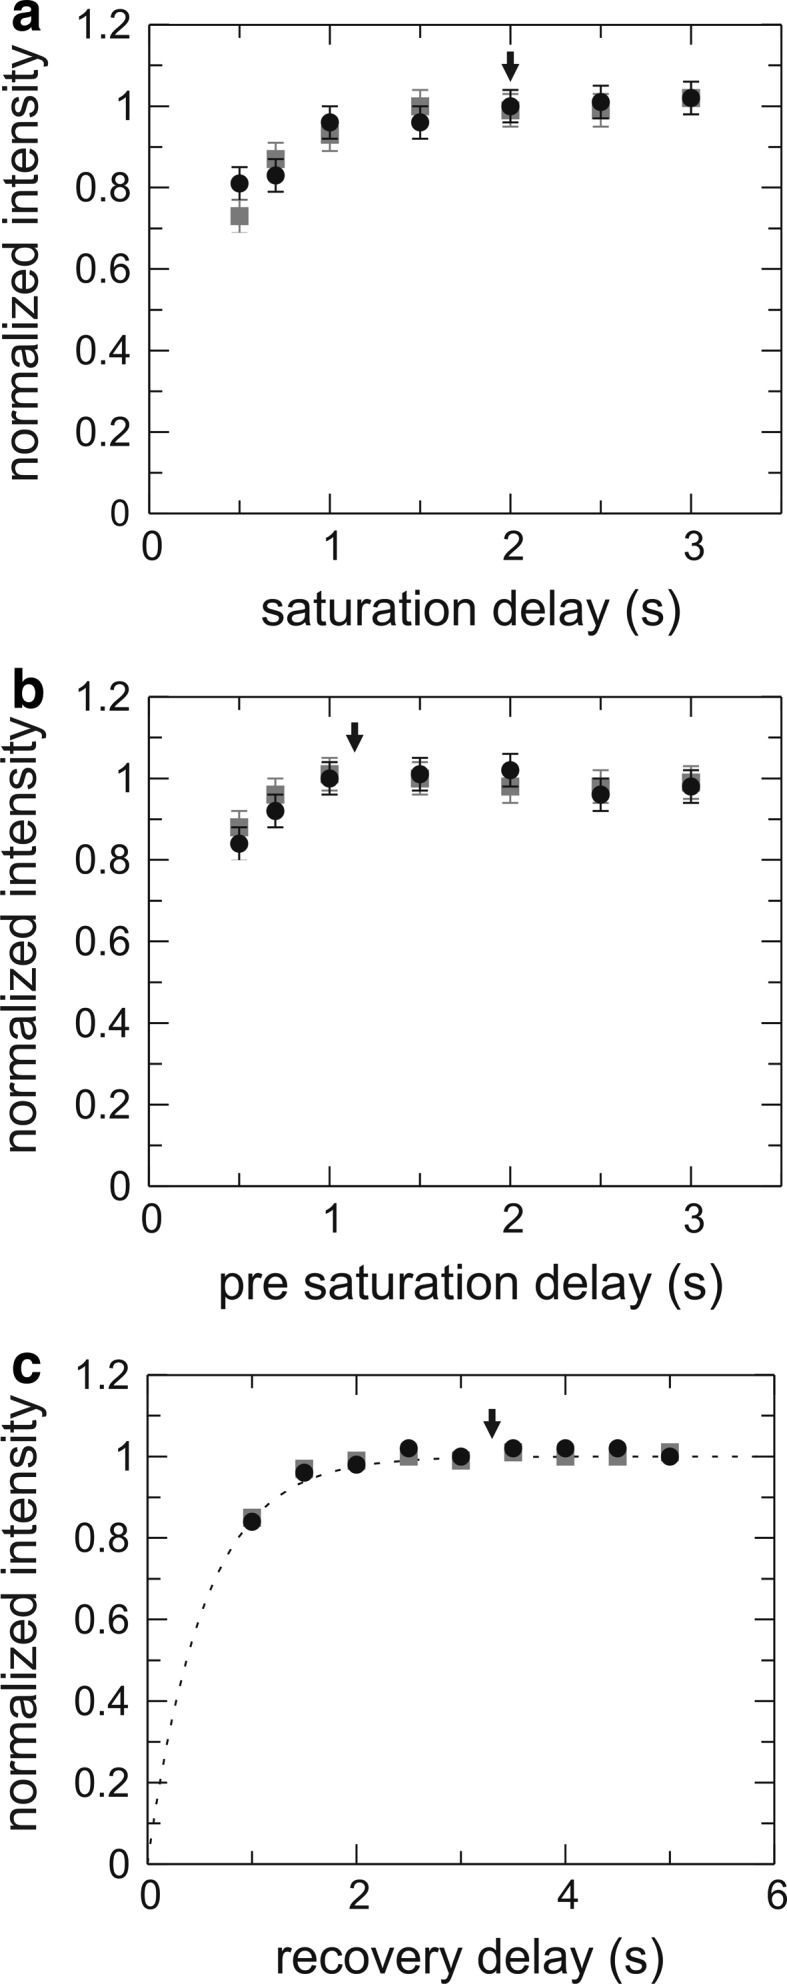
Fig. 6.

Intensity build-up in the aromatic {1H}–13C NOE experiment. a Difference intensity (saturation experiment − reference experiment) of the {1H}–13C NOE experiment shown as a function of 1H saturation time for the pulse sequences that correspond to the L-optimized (black circles) and non-L-optimized (grey squares) versions, using a constant pre-saturation delay of 4 s. b Difference intensity as a function of pre-saturation delays using a 1H saturation time of 2 s. c Intensity originating from 13C excitation (reference experiment) as a function of the recovery delay. Optimal delays are indicated with black arrows: the 1H saturation period is 2 s, and the pre-saturation delay is 1.3 s. The resulting recovery delay of 3.3 s equals approximately 6/R 1, ensuring that the 13C magnetization has completely returned to equilibrium. The data represent the summed intensity of four residues: Phe149 Cδ* + Phe159 Cδ* + Tyr118 Cδ* + Tyr221 Cδ*
