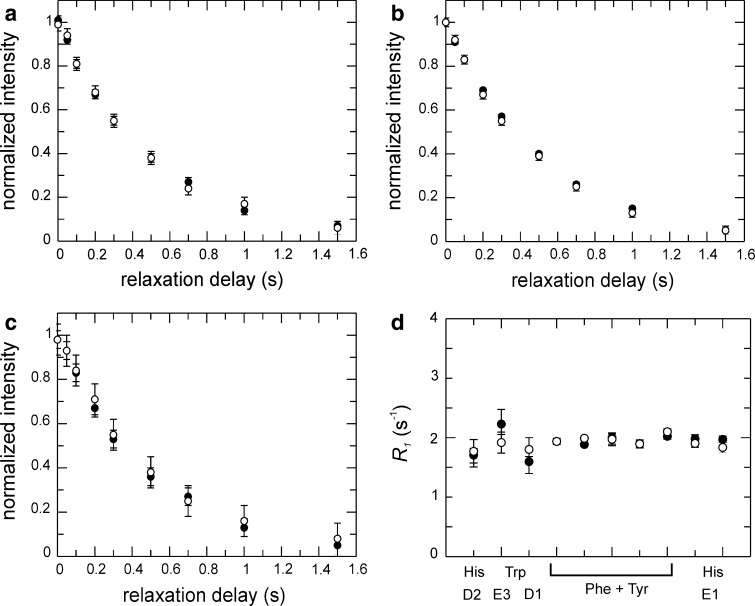
Fig. 7.
Comparison of 13C R 1 relaxation in partially deuterated and non-deuterated samples. a–c Representative R 1 relaxation decays measured for two Phe residues (a–b) and one His (c) on a partially deuterated sample (open circles) and non-deuterated sample (black circles). d Fitted R 1 relaxation rate constants for all 13C sites characterized in Gal3C. The deuteration levels at the vicinal sites are estimated to 50–55 % for Phe and Tyr 1Hε, and 60 % for Trp 1Hζ3 (see Table S1)

