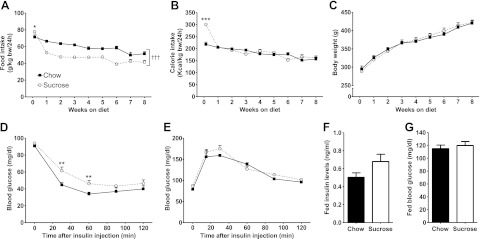
Figure 1.
The HSD-fed rat as a nonobese rodent model of insulin resistance. A) Food intake of chow-fed (solid squares with solid trace) and HSD-fed (open circles with dotted trace) rats was recorded over the first 24 h of feeding, and then weekly until the end of the protocol. *P < 0.05 and †††P < 0.001 vs. chow from 1 wk until 8 wk. B) Calorie intake was determined according to the energy content of the standard rodent chow (3.04 kcal/g) and of the HSD (3.90 kcal/g). ***P < 0.001 vs. chow at d 1. C) Body weight was measured for the same time points. Data are means ± se from 12 animals/group. D) An insulin tolerance test was performed starting 5 wk after the beginning of the feeding protocol by performing a subscapular subcutaneous injection of 0.5 U insulin/kg body weight in rats that were unfed for 18 h. Data are means ± se from 11 chow- and 9 HSD-fed rats. **P < 0.01 vs. chow. E) A glucose tolerance test was performed on rats that were unfed for 18 h after 5 wk on diet by administering 1g glucose/kg body weight by oral gavage of a 50% (w/v) glucose solution. Data are means ± se from 4 chow-fed and 5 HSD-fed rats. F, G) Fed plasma insulin levels (F) and fed blood glucose levels (G) were measured at time of sacrifice prior to heart perfusion. Data represent means ± se from 6 animals/group.

