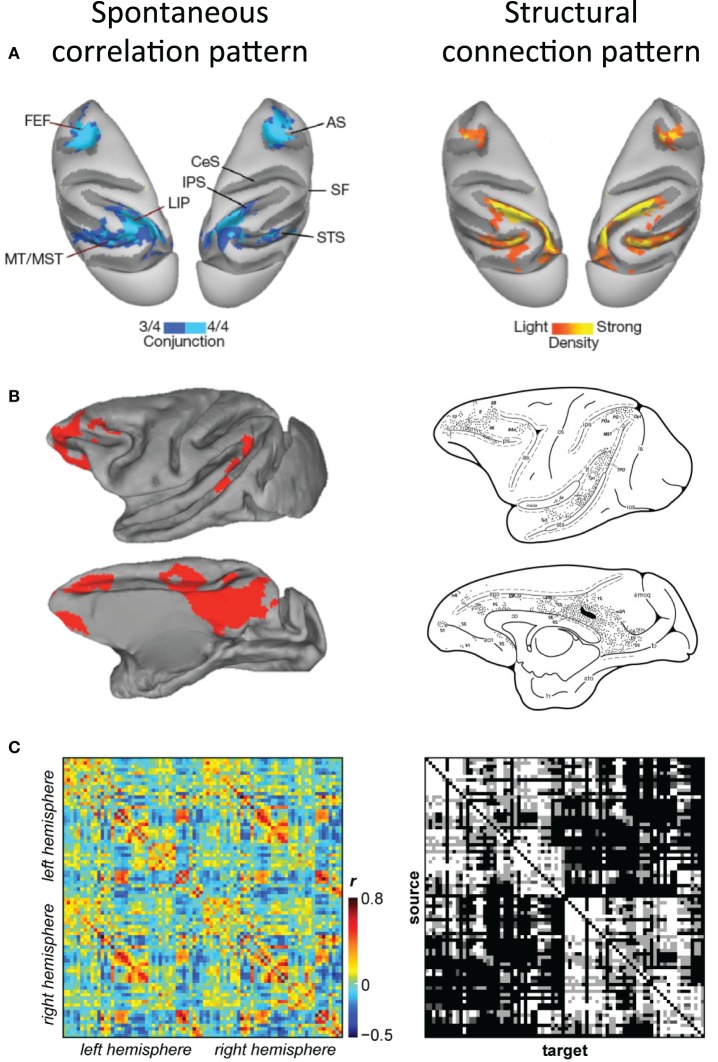
Figure 6.
Correspondence of functional and structural connectivity patterns in the macaque. (A) Conjunction map of functional connectivity the macaque oculomotor system (left) and density of cells labeled by retrograde tracer injections into right LIP (right) displayed on dorsal views of both hemispheres. (B) Correlation map of functional connectivity of macaque posterior cingulate cortex (left) and the structural connectivity patterns injection of tracers within a location comparable to the respective seed region (right) displayed on medial and lateral views of the left hemisphere. (C) Functional connectivity matrix of 82 cortical seed regions averaged across six macaques (left) and the corresponding structural connectivity matrix derived from the CoCoMac database (right). Modified with permission from (A) Vincent et al. (2007); (B) Margulies et al. (2009) and Morecraft et al. (2004); (C) Shen et al., in preparation.

