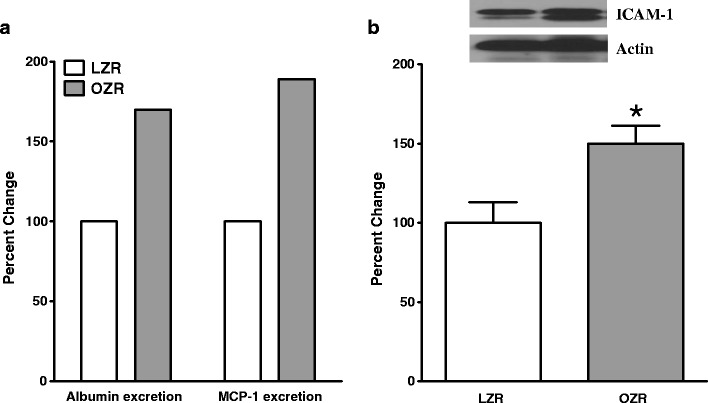
Fig. 6.

Bar graphs show urinary excretions of albumin and monocyte chemoattractant protein-1 (MCP-1) expressed as the percent of the LZR group (panel A). Panel B shows that renal tissue from (6-month-old) OZR displayed higher level of intercellular adhesion molecule-1 (ICAM-1) compared to age-matched LZR. Also shown are representative blots for ICAM-1 and β-actin (i.e., loading control). Data are means ± SEM of 7–9 animals/group. *p < 0.05 compared to LZR
