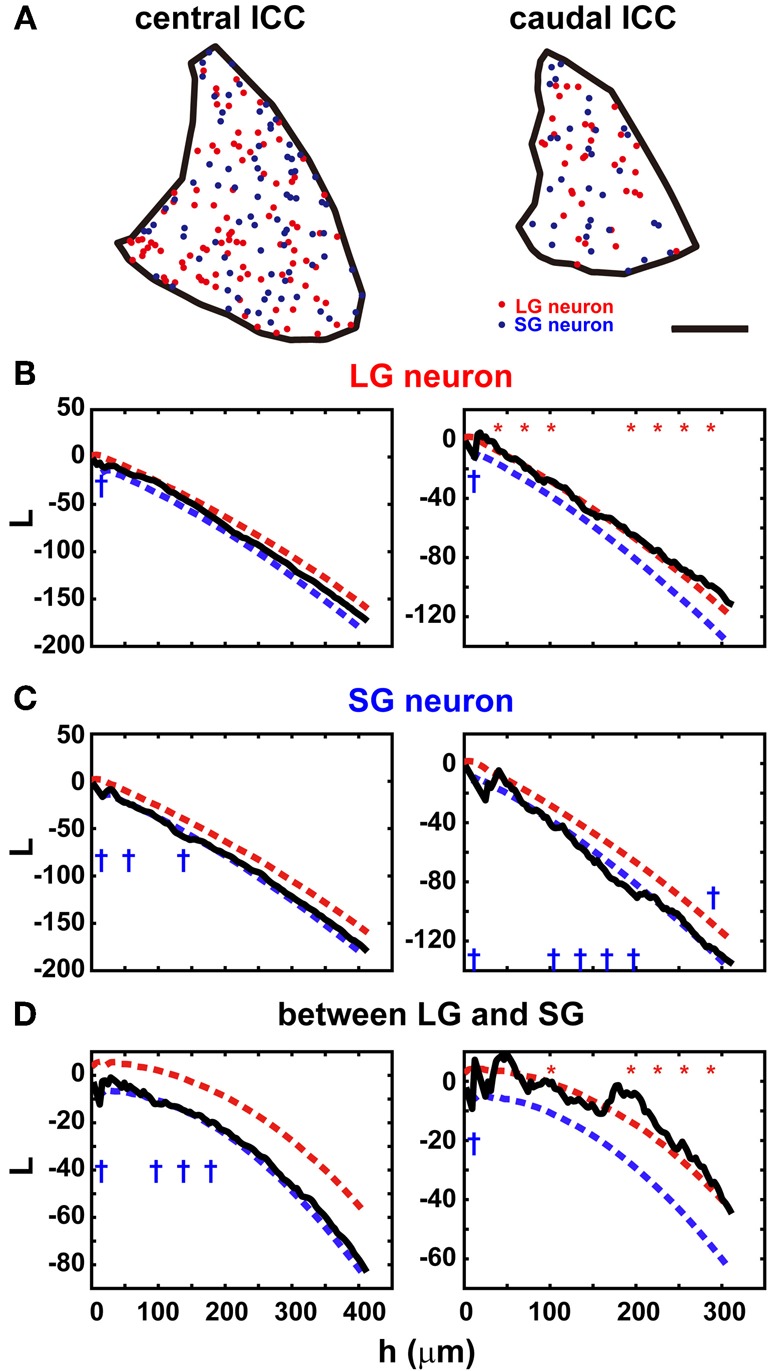
Figure 2.

Distribution in the ICC of two classes of GABAergic neurons. (A) Location of the cell bodies of LG neurons (red) and SG neurons (blue) in the ICC (black border). Left: center of the ICC. Right: caudal ICC. Note the sparse and clustered distribution in the caudal ICC. Scale bar: 400 μm. (B) The L function of LG neurons in the central ICC (left) and caudal ICC (right). Red and blue dotted lines are upper and lower limits of the 95% confidence interval, respectively. In the central ICC, the function falls primarily within the confidence limits, while in the caudal ICC, the function is slightly larger than the confidence interval. At 10 points of h evenly spaced, asterisks and daggers are shown if the function is larger or smaller than the confidence interval, respectively. (C) The L function of SG neurons in the central ICC (left) and caudal ICC (right). In the central ICC, the function falls within the confidence limits in the larger values of h. When h is smaller, the function falls below the confidence limit. In the caudal ICC, the L function is significant for larger values of h. (D) reciprocal L functions for two classes of GABAergic neurons in the central ICC (left) and caudal ICC (right). In the central ICC, the function is significant for only the smaller h. In the caudal ICC, the function is significantly at larger values of h.
