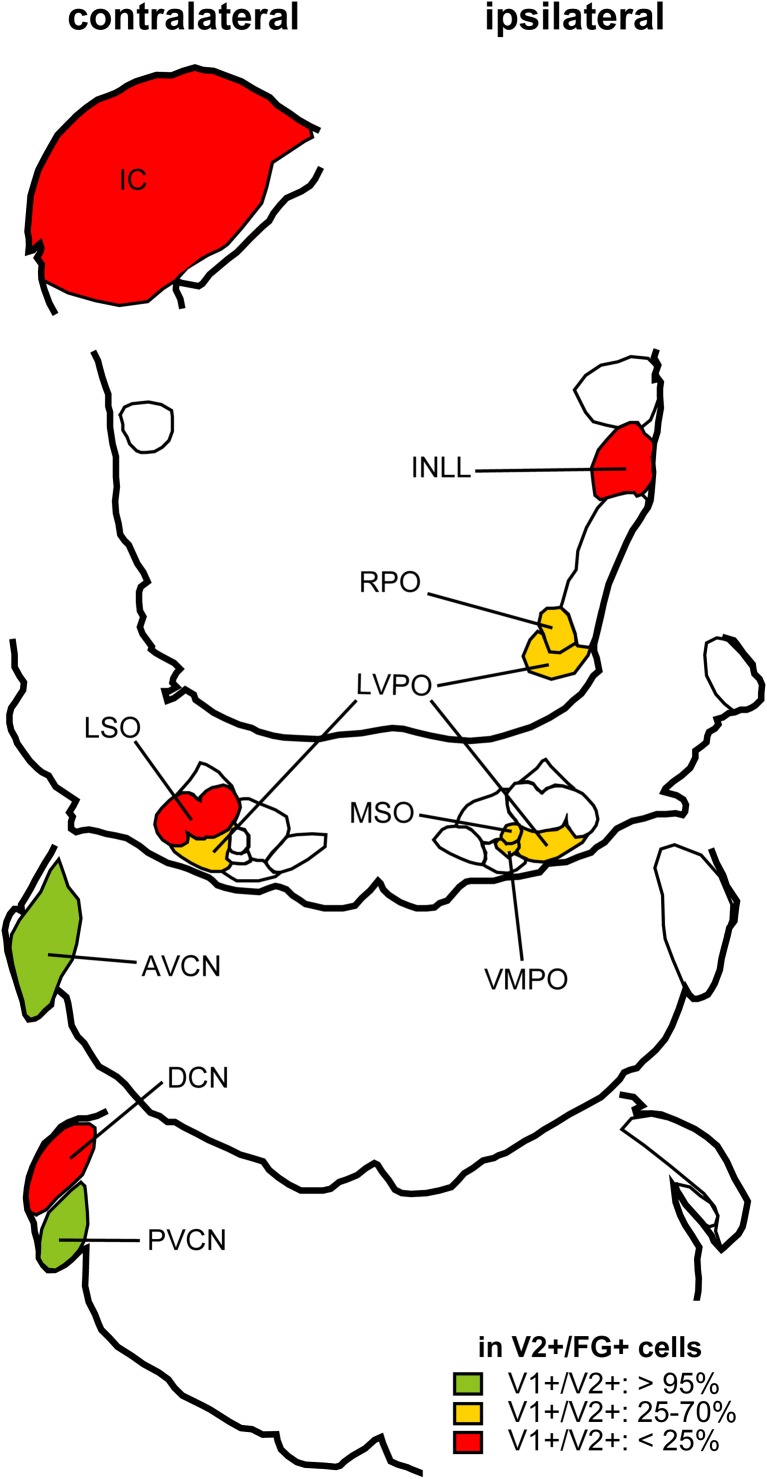
Figure 5.
Summary of distribution of retrogradely labeled glutamatergic cells after an injection of FG into the IC. Percentage of neurons positive for FG and VGLUT2 that co-localize VGLUT1 calculated from three cases. Nuclei that have more than 10 mean cell count of cells positive for both FG and VGLUT2 are shown. Red: Brainstem regions where fewer than 25% of cells express VGLUT1. Green: Nuclei where more than 95% cells express VGLUT1. Orange: Nuclei where 25–70% of retrogradely labeled cells co-expressed VGLUT1. Modified from Ito and Oliver (2010).

