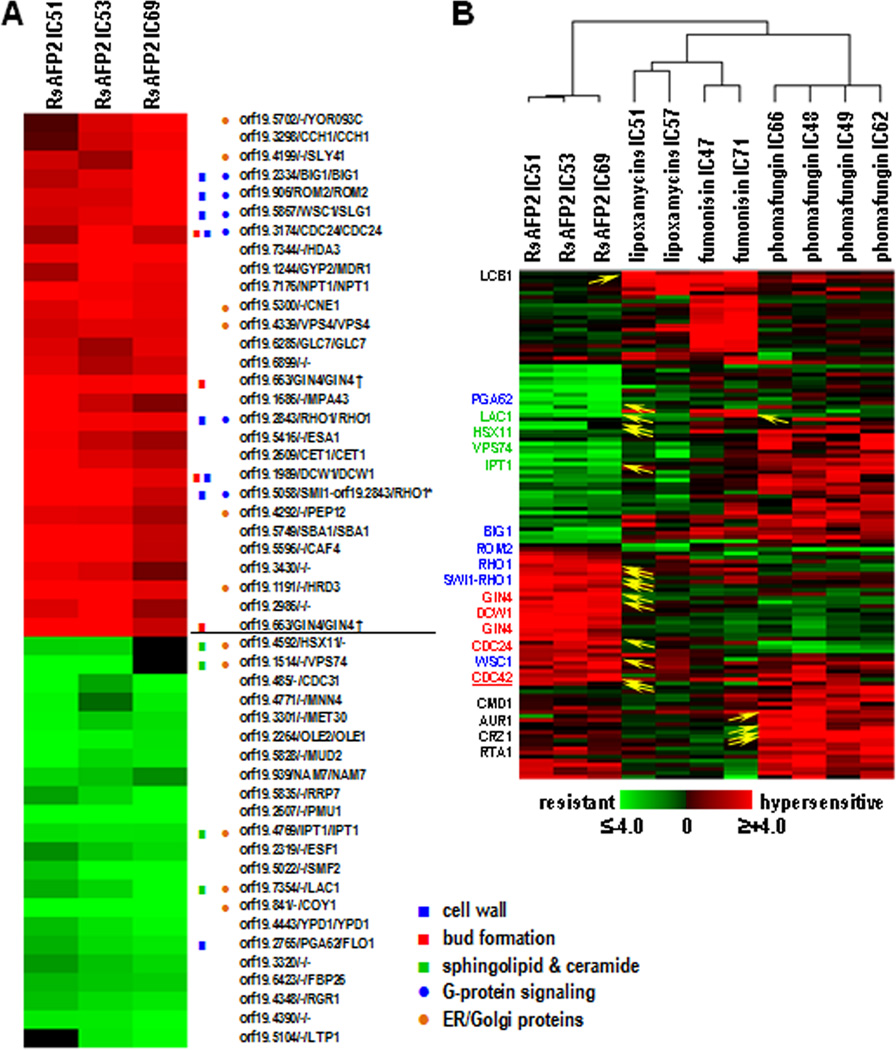
Fig. 1. CaFT profile of RsAFP2.
A, The plant defensin was tested at three different concentrations (10, 13 and 16 µg/ml, equivalent IC51, IC53 and IC69 in the CaFT using YPD/PDB medium. In the hierarchical clustering, heterozygotes with significant fitness variations were selected based on the absolute values of their z-scores (positive indicating hypersensitivity, and negative resistance) being ≥3 in at least two experiments. Gene annotations were adopted from the Candida Genome Database in following order: orf19 designation, C. albicans gene name, S. cerevisiae ortholog/homolog. Highlighted are those described in the text, with the functional group indicated. B, Comparison of the CaFT profiles of RsAFP2 and other antifungal natural products that affect sphingolipid/ceramide biosynthesis, by hierarchical clustering. Heterozygotes were selected as described in A. Yellow arrows indicate the corresponding genes that are related to the Mode of Action (MOA) of compounds in question, with gene names given on the left. The three functional groups (reflecting the MOA of RsAFP2) described in the text are highlighted in color, with those in black reflecting MOAs of other natural products. Note that the same heat map scale is used in both A and B, with black indicating data not available (most likely) due to low hybridization signals (and thus excluded from z-score calculation).

