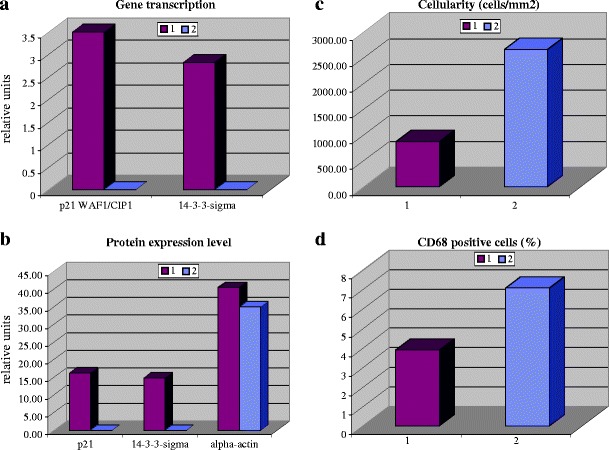
Fig. 3.

Comparative analysis in two groups of patients with non-calcified (1) versus calcified (2) degenerative aortic valves. All analyses have been performed as described earlier [20]. The corresponding mean values are presented with statistically significant differences between the groups of comparison. (a) Comparative gene expression analysis (mRNA level in relative units) of p21WAF1/CIP1 and 14-3-3-sigma. Quantitative Real-Time-PCR was applied. Beta-actin was used as the house-keeping gene for normalisation of corresponding values of the target gene expression rates. (b) Comparative analysis of protein expression levels (in relative units) of P21WAF1/CIP1, 14-3-3-sigma and alpha-actin. (c) Comparative analysis of cellular density (in relative units). (d) Comparative analysis of macrophages (in relative units)
