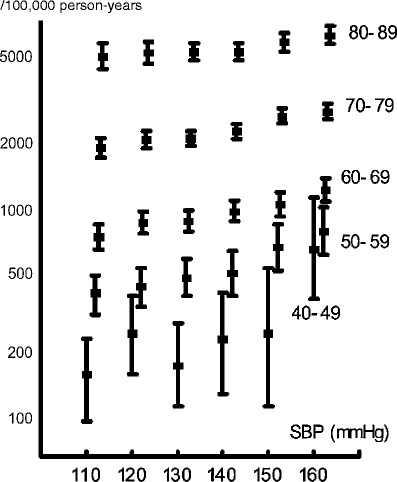
Fig. 1.

Relation between blood pressure and multivariate-adjusted mortality rate by age range (men and women combined). Each dot represents a multivariate estimate of mortality rate after adjusting for sex, smoking, drinking, and body mass index, and each line shows the 95% CI [10]
