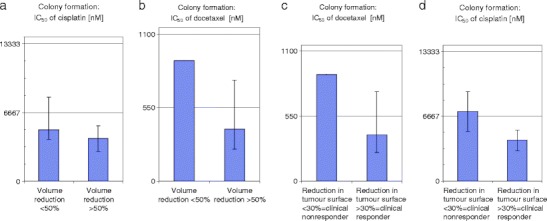
Fig. 2.

Comparison of IC50 concentrations (inhibitory concentration which diminish colony formation to 50%) in the FLAVINO assay [35] of HNSCC with lower response to TPF-IC with good responders. (a), (b): based on volume reduction <50% (left) vs. >50% (right); (c), (d): based on tumour-surface reduction <30% vs. (left) vs. >30% (right). Horizontal lines in a, c and b, d, represent maximum tolerable plasma levels of cisplatin (6,667 nM [36]) and docetaxel (550 nM [37]), respectively. Clear differences in IC50 for P and T exist between responders and no responders, and these allow for their distinction and hence could build a rational to analyse chemo response before starting chemotherapy
