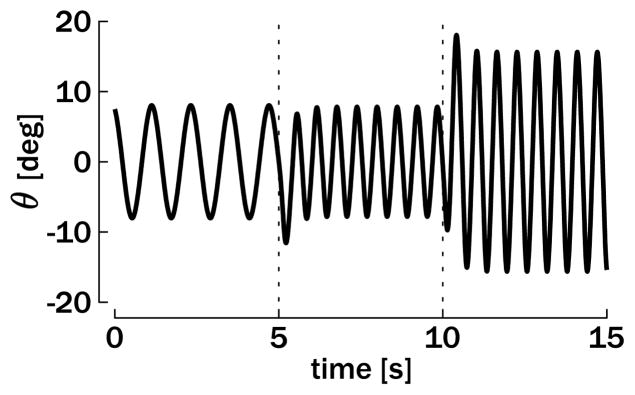
Figure 12.
Simulation of a unimanual rhythmic movement. The plot depicts the position output θ when the reference period is T = 1.2 s for the first 5 seconds of the simulation and T = 0.6 s for the last 10 seconds. The reference amplitude is Aθ = 8 deg for the first 10 seconds and Aθ = 16 deg for the last 5 seconds.

