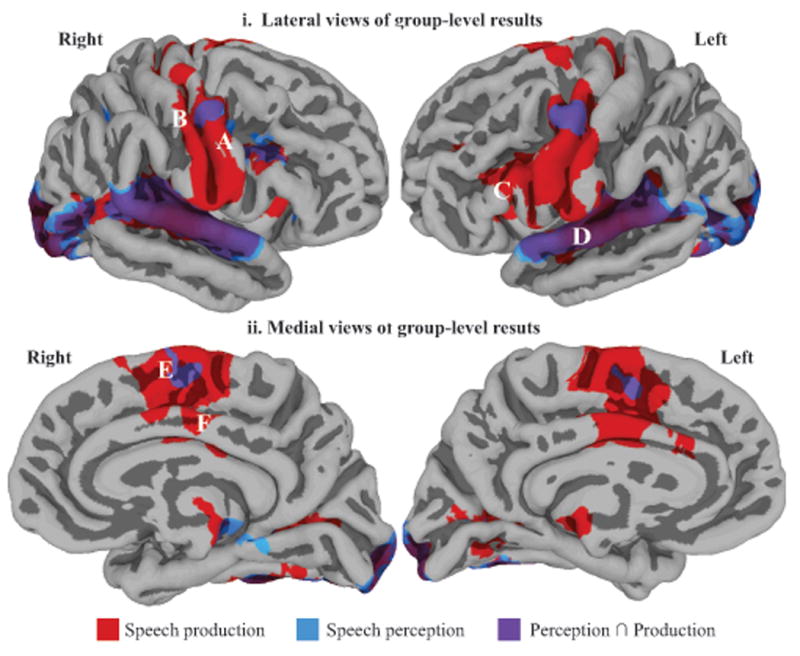
Figure 2.

Regions significantly active, at the group-level, for perception (in blue), production (in red) and for the conjunction of perception and production (in purple), shown on lateral (i) and medial views of the cerebral hemispheres (ii). Activation is shown on the group average smoothed white matter folded surface. Some relevant anatomical landmarks are identified on the brains: A = ventral precentral gyrus, B = ventral postcentral gyrus, C = pOFG, D = STG, E = medial frontal gyrus (pre-SMA), F = cingulate gyrus.
