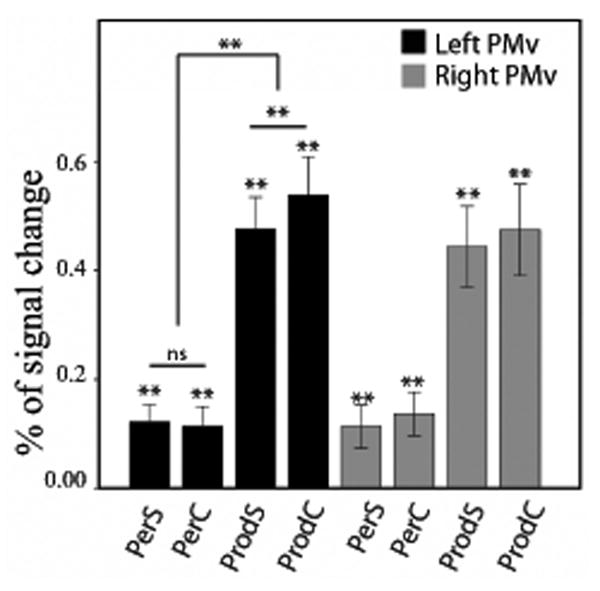
Figure 3.

Brain activity (expressed as a percentage of signal change) for speech perception and speech production, in the left (black bars) and right sPMv (gray bars). Double asterisks indicate a significant (FDR corrected, q = 0.05) difference (paired sample t-test), either between two conditions, or against zero (one-sample t-test). PerS = perception of Simple words; PerC = perception of complex words; ProdS = production of simple words; ProdC = production of complex words. The error bars represent the standard error (SE) of the mean.
