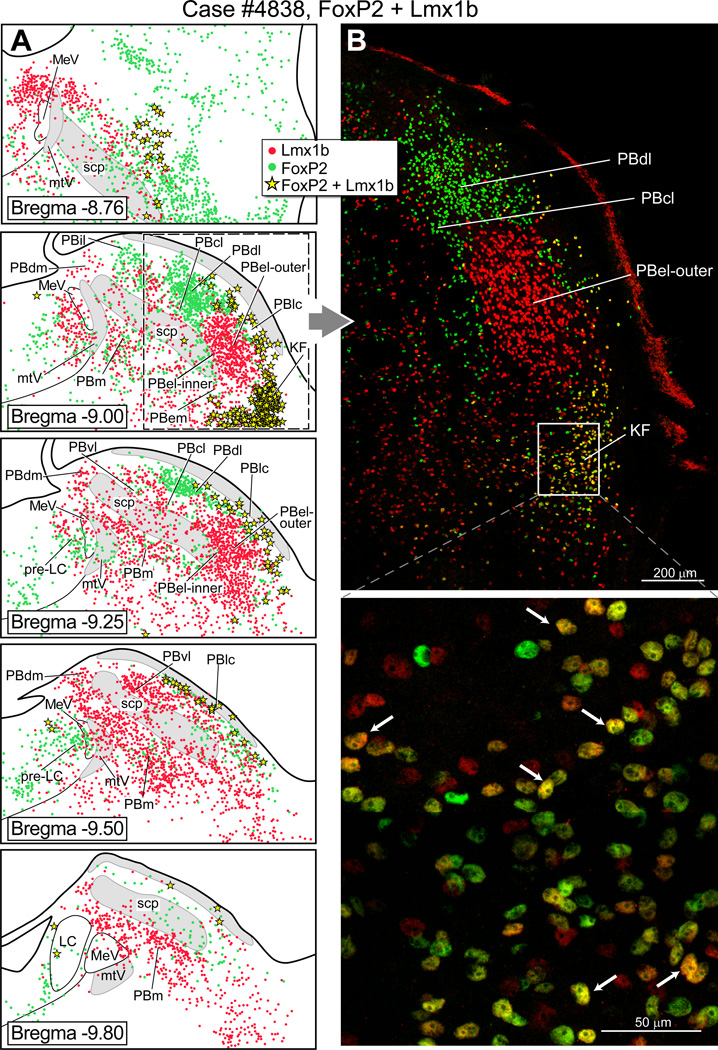
Figure 1.
Cytoarchitectonic map of the rat parabrachial nucleus showing neurons that express the transcription factors FoxP2 and Lmx1b. (A) Line drawings of transverse sections of the dorsolateral pons illustrating the distribution of FoxP2 +and Lmx1b+ neurons in parabrachial subgroups. Bregma levels (in millimeters) are indicated on the lower left side of each drawing, based a standard rat brain atlas (Paxinos and Watson, 2005). (B) Upper panel: Photo image of the lateral parabrachial region to show collections of FoxP2+ neurons (green dots) in the PBdl and PBcl subnuclei. A dense cluster of Lmx1b+ neurons (red dots) is shown in the PBel-outer subdivision. Lower panel: Higher magnification of the Kölliker-Fuse nucleus (KF) neurons to show that most of these cells co-express FoxP2 and Lmx1b (yellow).

