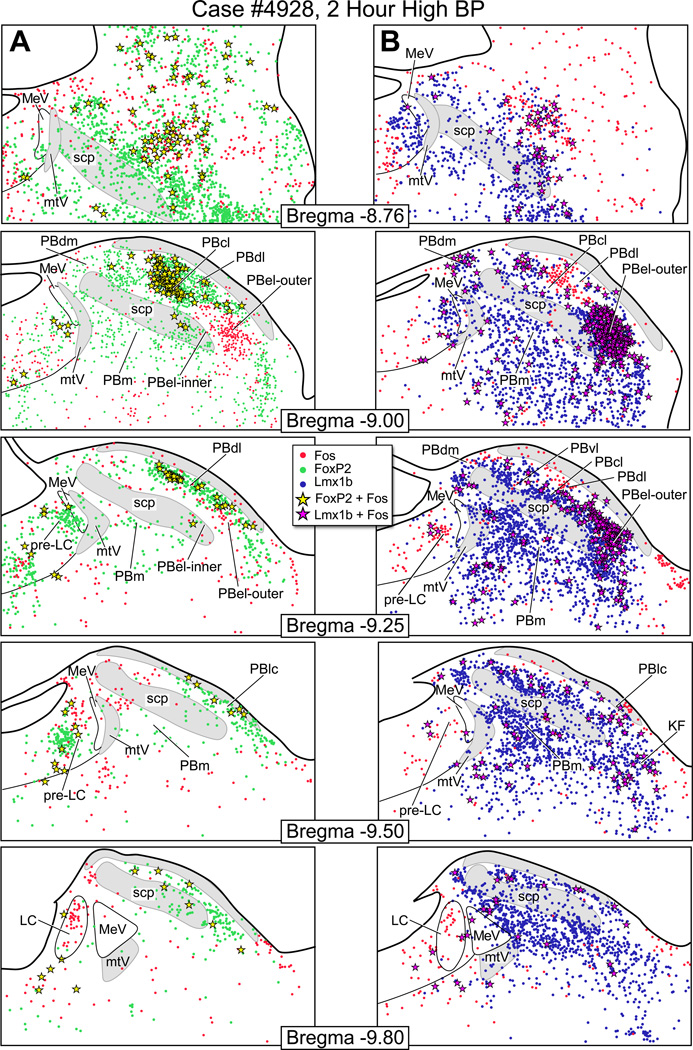
Figure 6.
Line drawings through the parabrachial nucleus illustrating the distribution pattern of Fos activation after two hours of hypertension. (A) Series of rostral to caudal drawings showing the distribution of Fos-activated neurons (red dots), FoxP2 neurons (green dots), and co-labeled Fos & FoxP2+ neurons (yellow stars). (B) These brainstem drawings to illustrate the distribution of Fos-activated neurons (red dots), Lmx1b+ neurons (blue dots), and co-labeled Fos & Lmx1b+ neurons (magenta stars). In Panel B, the bregma −9.0 and −9.25 levels had a large number of c-Fos activated Lmx1b+ neurons in the PBel-outer subgroup.

