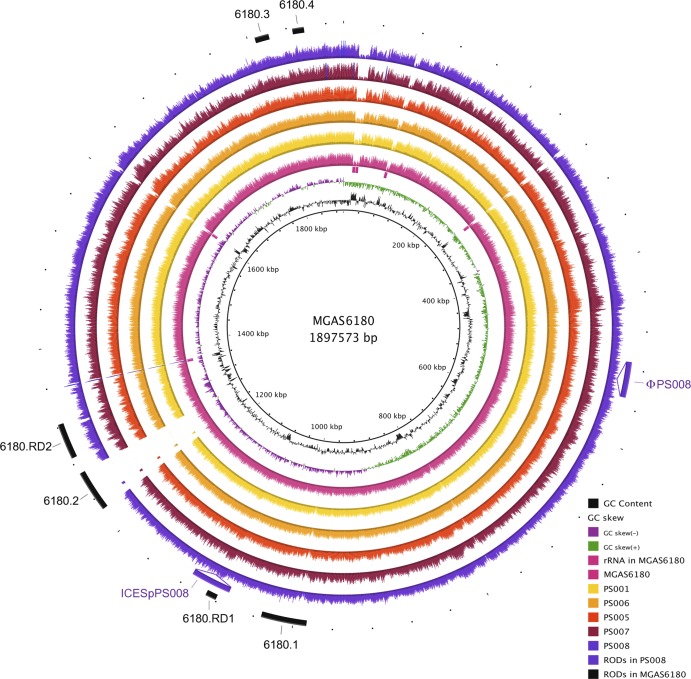
Fig 2.
Visualization of the reads selected for each strain mapped onto the S. pyogenes MGAS6180 reference genome. The innermost circles represent the GC content (black), GC skew (purple/green), and rRNA operons of MGAS6180 (pink boxes). BRIG (1) shows the distribution of the number of reads for each individual strain mapped onto the central reference using a window size of 500, arranged from inner to outer colored circles as follows: resequenced reference MGAS6180 (pink), PS001 (yellow), PS006 (orange), PS005 (red), PS007 (maroon), and PS008 (purple). Additional strain-specific regions of difference (RODs) (ϕPS008 and ICESpPS008) are represented as insertions. The outermost circle represents previously reported regions of difference in MGAS6180, namely, prophage elements 6180.1 and 6180.2, prophage remnants 6180.3 and 6180.4, and regions of difference 6180.RD1 and 6180.RD2 (15) (black).

