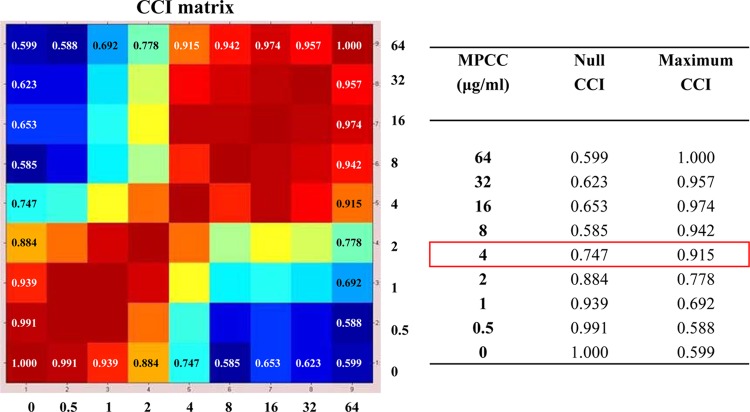
Fig 1.
Representative composite correlation index (CCI) matrix derived from selected mass spectra, which correspond to those for C. glabrata DSP155 cells (MIC of 4 μg/ml) exposed for 15 h at 37°C to serial caspofungin concentrations (including the null one), ranging from 0.5 to 64 μg/ml. By comparing spectra with one another at the indicated drug concentrations, numerical correlation indices were obtained, automatically visualized in a CCI matrix view, and translated into a heat map (on the left) in which closely related spectra are marked in hot colors and unrelated ones in cold colors. After matching for each concentration and its spectrum similarity against each of the two extreme concentrations (null or maximum) of the drug, the minimal profile change concentration (MPCC) was assessed as the CCI value at which a spectrum is more similar to the one observed at the maximum caspofungin concentration (maximum CCI) than the spectrum observed at the null caspofungin concentration (null CCI). The MPCC (4 μg/ml) and its relative null and maximum CCI values are shown on the right in the red box.

