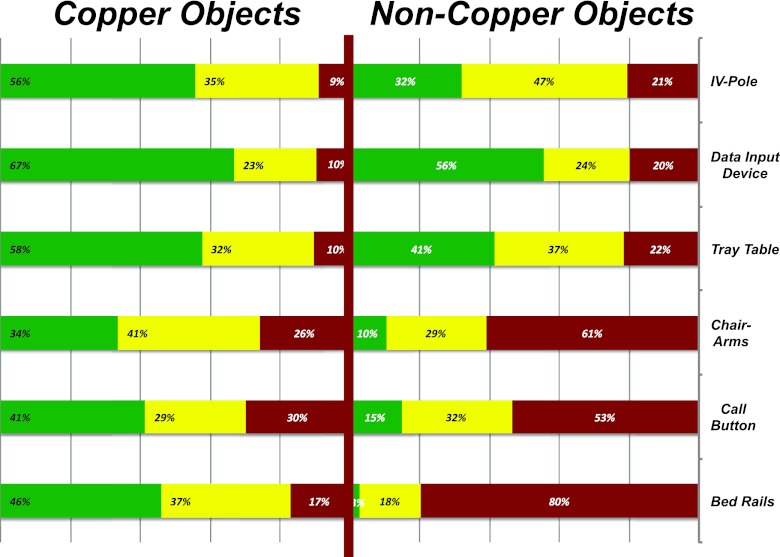
Fig 4.
Frequency distribution of the MB resident on all objects (classified by type) during the intervention. The MBs observed for each sample from rooms with copper-surfaced objects are represented on the left; those observed for each sample from rooms without copper-surfaced objects are represented on the right. The concentration of bacteria observed for each sample was placed into one of three categories, 0 CFU/100 cm2 (green bars), 1 to 250 CFU/100 cm2 (yellow bars), and >250 CFU/100 cm2 (red bars), and the final percentage, rounded to the nearest whole number, of each category was determined.

