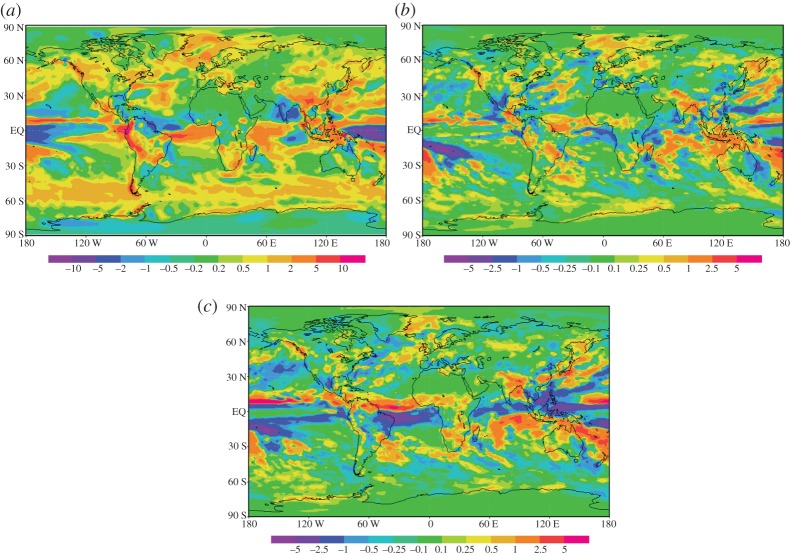
Figure 2.
A comparison between model and observed precipitation, and investigation into the impacts of MCB on model precipitation (mm per day). (a) Comparison of the CMAP precipitation dataset with a current CO2 level simulation in HadGEM1. (b) The effect of increasing carbon dioxide from 440 to 560 ppm within the model. (c) The difference between a geoengineered simulation, 2CO2 and a control simulation. (Online version in colour.)

