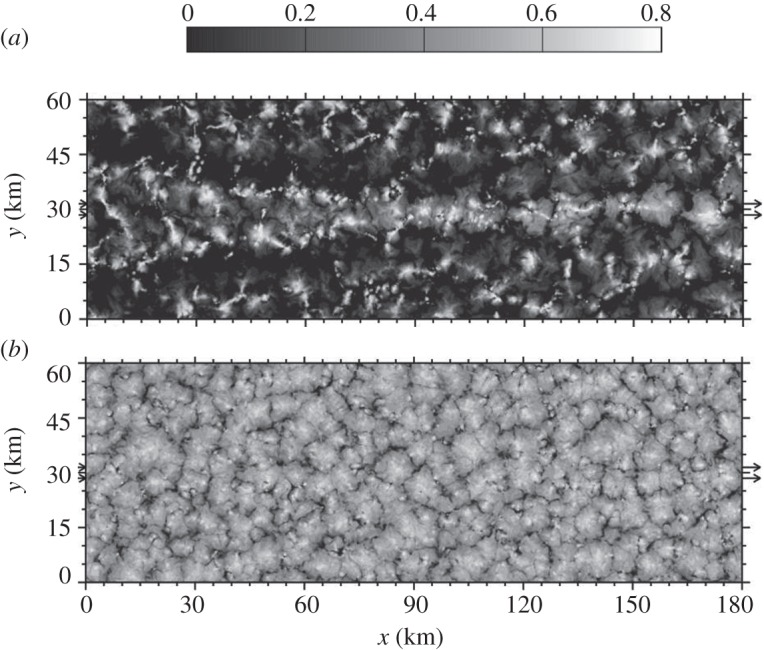
Figure 5.

Snapshots of the cloud albedo field when ships pass through the domain once from x=0 to 180 km, about 7 hours after the start of the simulations. The background aerosol number concentration varies linearly from a lower bound at x=0 to an upper bound at x=180 km; (a) clean case 60–150 mg−1 and (b) the polluted case 210–300 mg−1. Arrows indicate the direction of movement of the ships and the band of ship plumes emitted near the surface. Details on the model and experimental set-up can be found in Wang & Feingold [33,34].
