
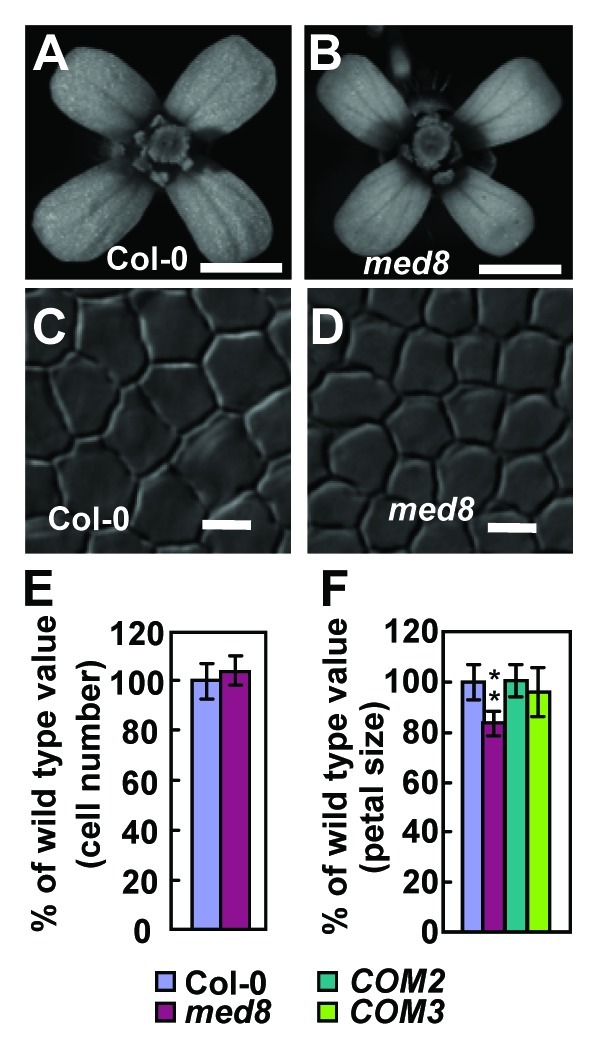
Figure 1.med8 mutant forms small flowers. (A and B) Flowers of Col-0 and med8. (C and D) Adaxial epidermal cells in Col-0 and med8 petals. (E) The number of adaxial epidermal cells in Col-0 and med8 petals. Each value represents measurements from more than 10 petals. (F) Petal area of Col-0, med8, COM2 and COM3. COM is med8 transformed with MED8 cDNA sequence driven by the 2362 bp MED8 promoter. Petals from opened flowers (stage 14) were used to measure petal area. Each value for petal area represents measurements from more than 30 petals. Values (E and F) are given as mean ± standard deviation (s.d.) relative to the respective wild-type values. **, p < 0.01 compared with the wild type (Student’s t-test). Scale bar, (A and B), 1mm; (C and D), 10μm.