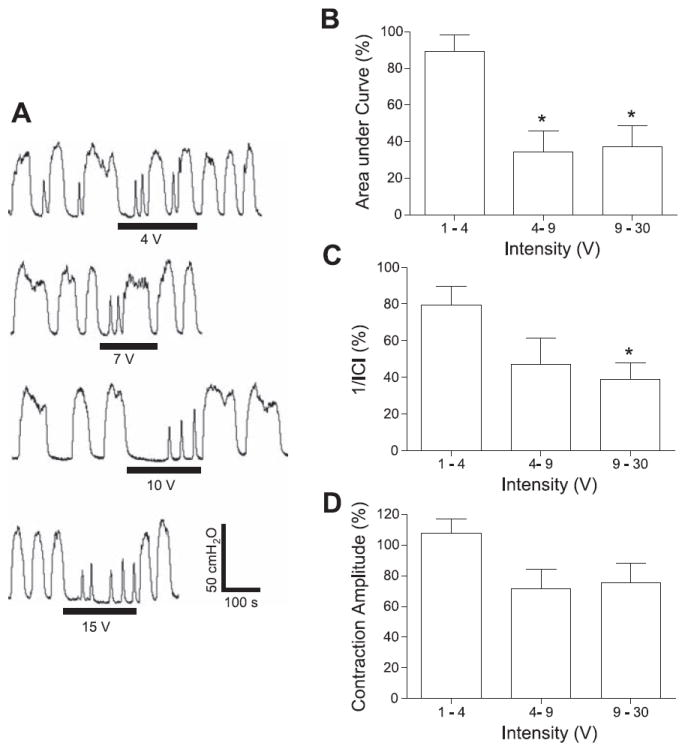
Fig. 3.

Intensity-dependent inhibitory effect on rhythmic bladder activity induced by electrical perigenital stimulation. A: effect on bladder pressure traces at different intensities. The black bars under bladder pressure traces mark the stimulation duration. B: area under bladder pressure curve. C: reciprocal of ICI (1/ICI). D: average bladder contraction amplitude. Bladder response during stimulation was normalized to the response before stimulation in B–D. Stimulation: 7 Hz; 0.2-ms pulse width. The calibration bars in A apply to all bladder pressure recordings. *Statistical significance (P < 0.05); n = 3.
