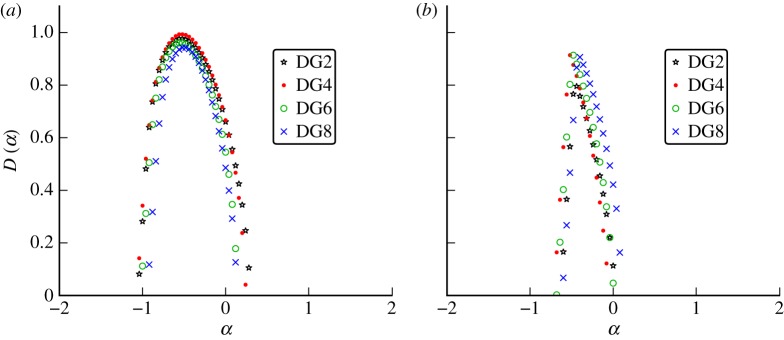
Figure 7.
Wavelet choice: the multifractal singularity spectra computed from (a) measles incidence of infection data reported monthly in Ontario, Canada, from 1904 to 1989 and (b) the number of chicken pox cases reported weekly in Ontario from 1925 to 1958. Gaussian wavelets were tested against the data using an increasing number of vanishing moments. The order of the wavelet and thus the number of vanishing moments of the wavelet is given by the number of derivatives of the Gaussian. (Online version in colour.)

