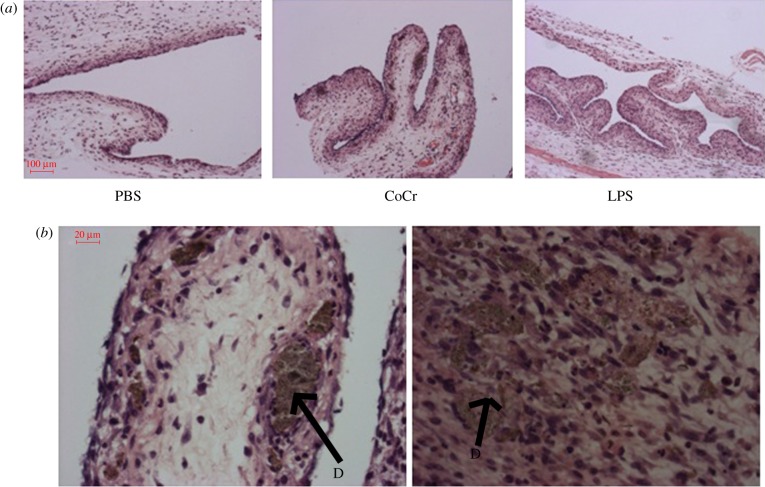
Figure 6.
The histological appearance of negative (PBS) and positive (LPS) control and CoCr-treated air-pouch membranes, 24 h post-injection. (a) Images taken at 10× magnification of PBS-, CoCr- and LPS-treated air-pouch membranes. (b) Images taken at 40× magnification of CoCr-treated air-pouch membranes. ‘D’ indicates CoCr debris within the tissue. (Online version in colour.)

