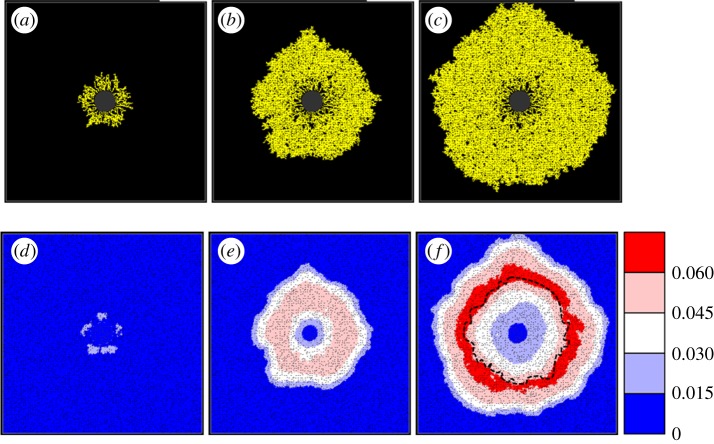
Figure 4.
(a–c) Growth of the simulated retinal astrocyte network. (d–f) Simultaneous evolution of the VEGF-A concentration profile. Migration of astrocytes begins at E15—the snapshots shown here correspond to (a,d) E17.1, (b,e) P0.4 and (c,f) P4.0. (f), Dotted line illustrates the extent of endothelial cells migration. All simulated VEGF-A concentrations are as per the colour bar provided.

