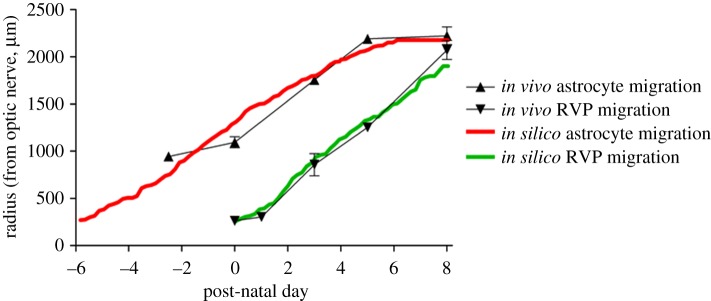
Figure 6.
Plot comparing the rate of frontal advance of astrocytes and endothelial cells obtained experimentally with those obtained by simulation. Astrocyte migration is represented by triangles with error bars (in vivo) or a solid red line (in silico), whereas endothelial cells migration is represented by inverted triangles with error bars (in vivo) or a solid green line (in silico).

