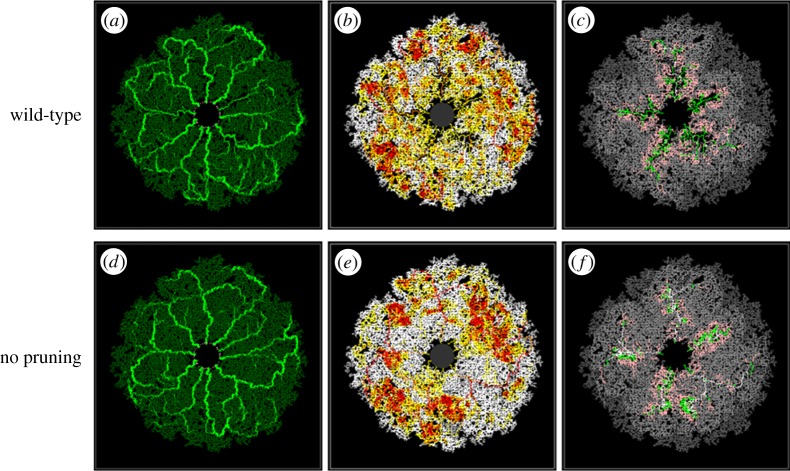
Figure 9.
Snapshots at P7.7 displaying the simulated vessel radii (a,d), haematocrit (b,e) and vessel oxygen (c,f) distributions in the presence (a–c) and absence (d–f) of capillary pruning. The vascular architecture in each simulation evolves identically, with the exception of any occurrences of pruning in the wild-type simulation. The relevant colour bars can be found in figure 6.

