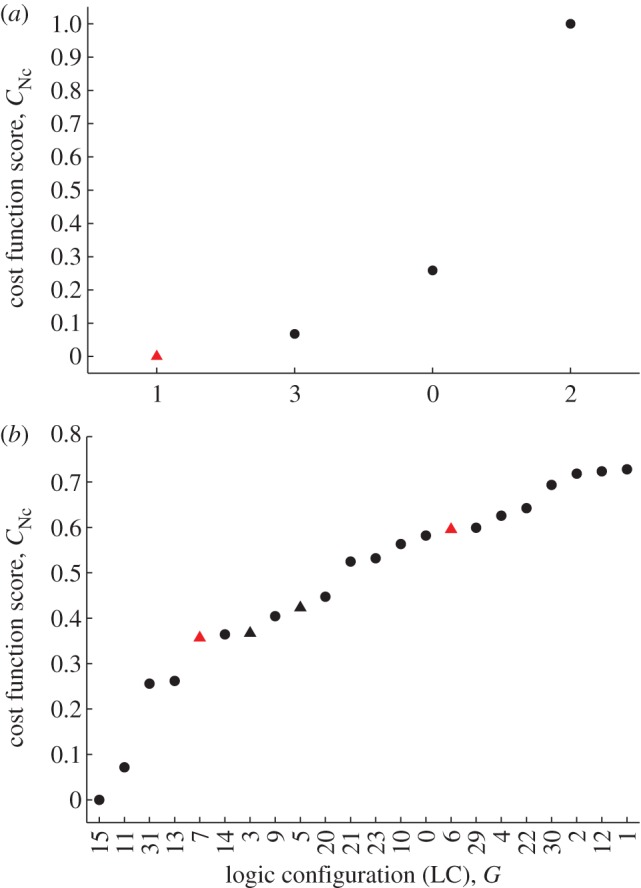
Figure 4.

The results of exploring the logic configurations (LCs) belonging to the abstract topologies of the (a) 1-loop and (b) 2-loop Neurospora models. Cost scores are shown for the optimal fit of each LC to synthetic data. The LCs are indexed by their decimal representations for brevity (see §4 for details). Here, a score of 0 indicates the best fit and a score of 1 the worst fit. Triangles indicate LCs for which the Boolean model yields a viable clock. LCs mirroring the activation and inhibition pattern of the corresponding DE models in figure 1a,b are plotted in red. In (a), one such LC mirrors the corresponding DE model, G = (01), and this emerges as the optimal configuration yielding a viable clock. In (b), only LCs yielding scores less than 0.75 are shown. There are two that mirror the equivalent DE model. One of these, G = (00111), is identified as the optimal configuration giving a viable clock (leftmost red triangle). In this LC, either of the FRQ isoforms can independently inhibit transcription (the corresponding two-input gate is of the AND type).
